
Fig. 2.
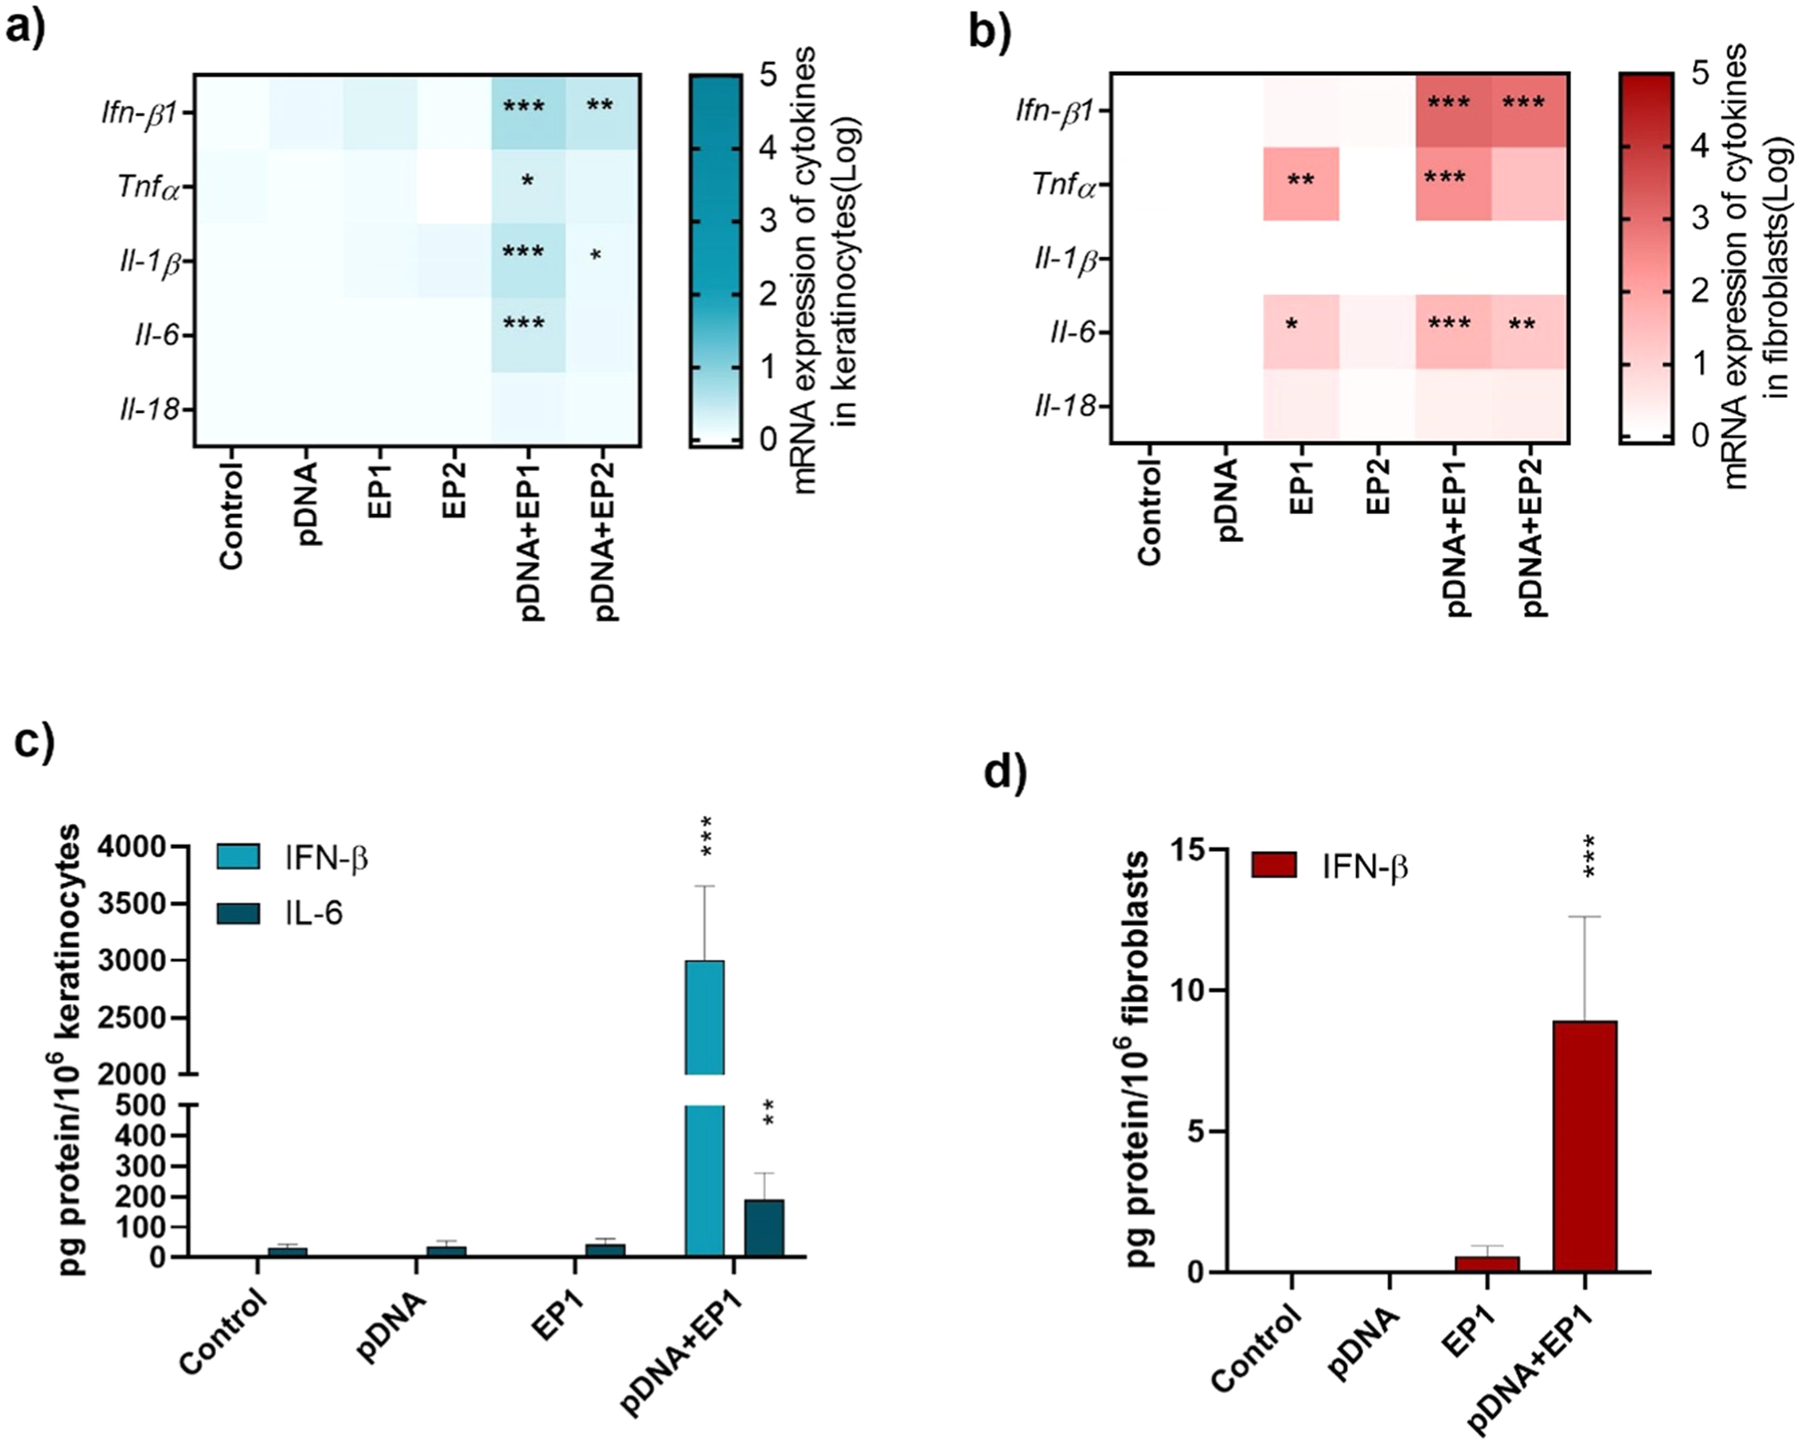
Normalized expression of cytokine mRNA in a) keratinocytes and b) fibroblasts (n = 3–6). Protein detected in the medium by ELISA in c) keratinocytes and d) fibroblasts (n = 4), * **p < 0.001, * *p < 0.01, * p < 0.05 compared to control. Fold expression is shown in a logarithmic scale.