
Fig. 6.
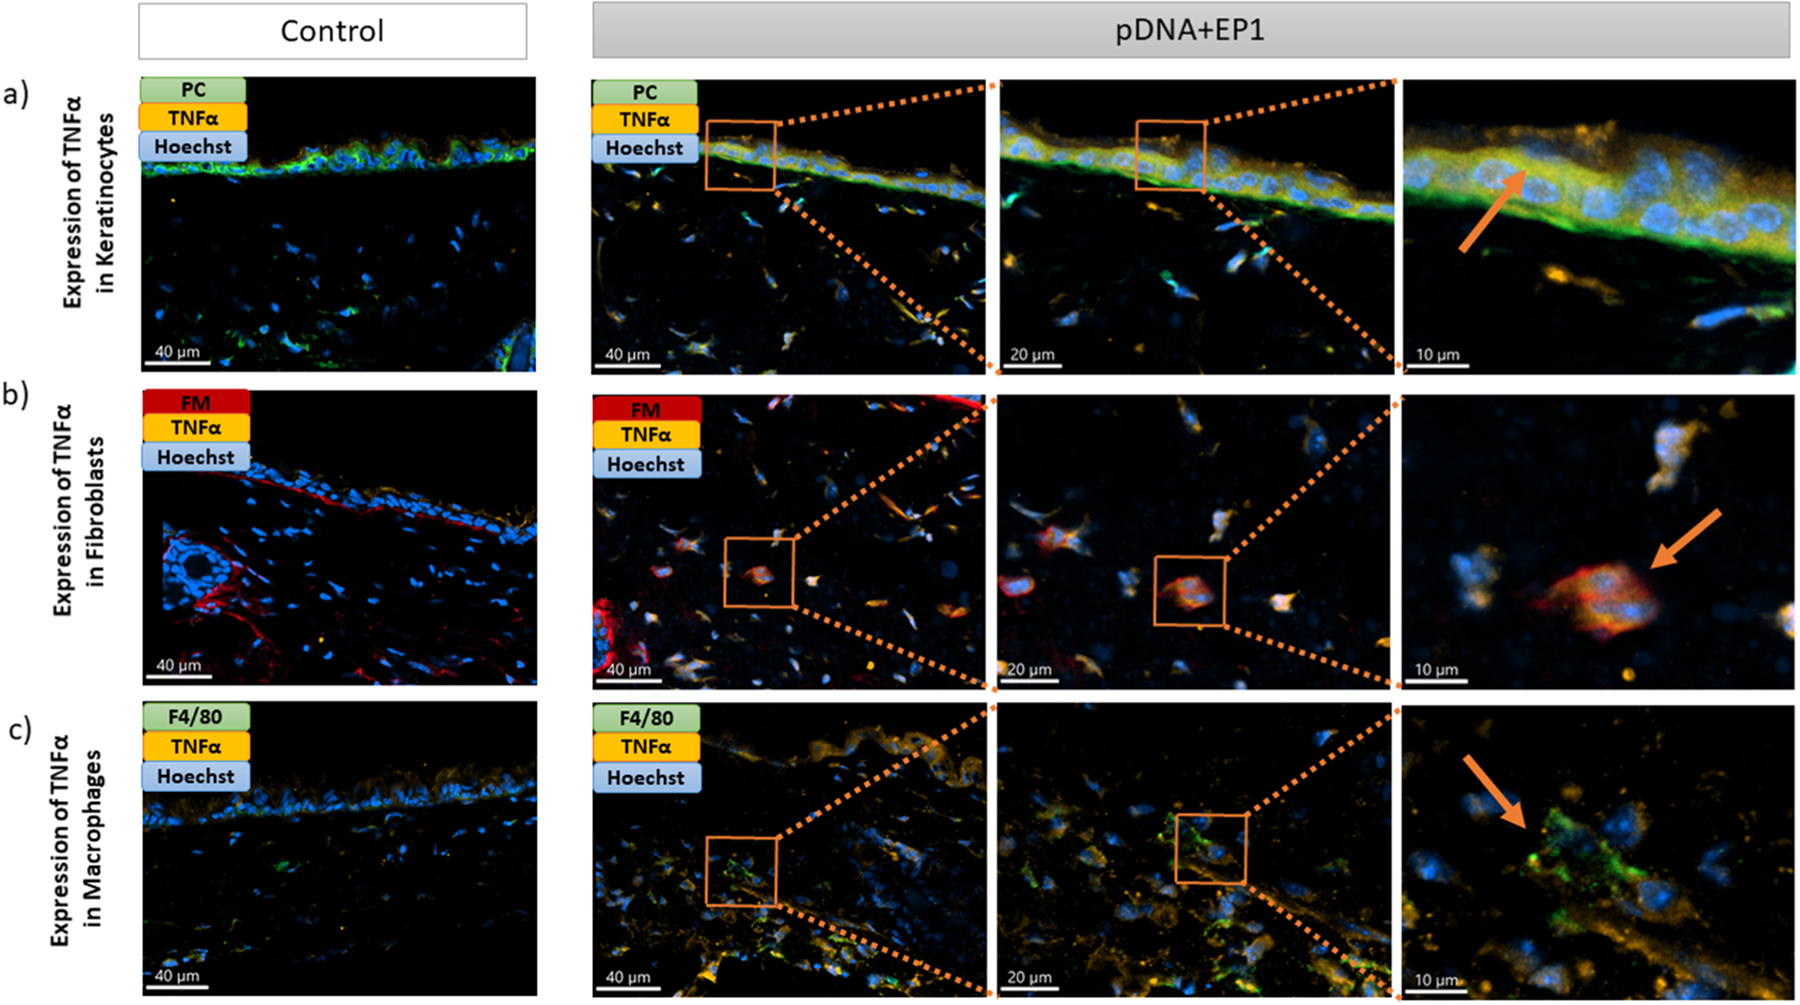
Detection of TNFα (TNFα -orange) in a) keratinocytes (Pan cytokeratin-green), b) fibroblasts (Fibroblast marker-red) and c) macrophages (F4/80-green) on frozen mouse skin Section 6 hours after pDNA electrotransfer. Three different images on the right side represent the zoom into the ROI. Arrows show detection of TNFα in different cells. Scale bar: 40 μm for the control column and first column of pDNA+EP1 (right side), 20 μm for the second column of pDNA+EP1, 10 μm for the third column of pDNA+EP1.(For interpretation of the references to colour in this figure legend, the reader is referred to the web version of this article.)