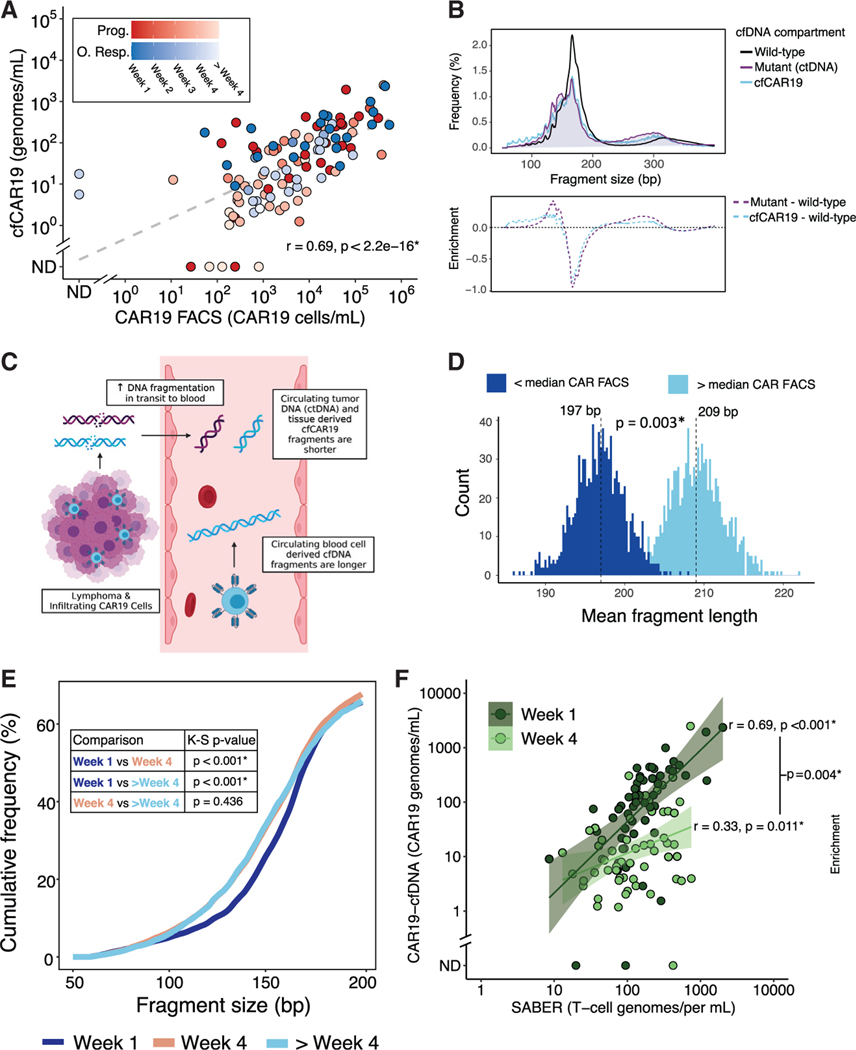
Figure 3. Profiling of engineered and other effector T cells from cfDNA.
(A) Correlation between CAR19 T cell levels as quantified by flow cytometry and STEP (cfCAR19) determined using Spearman’s rank-order method in samples from patients in the discovery cohort. Color depicts outcome and shading depicts time point of blood draw. Dashed line depicts linear regression line.
(B) (Top) Aggregate fragment length profiles of wild-type cfDNA (black), ctDNA (purple), and cfCAR19 (blue) molecules across all evaluable plasma sam-ples.
(Bottom) Enrichment of ctDNA (purple) and cfCAR19 (blue) relative to wild-type cfDNA across the fragment length spectrum.
(C) Illustration demonstrating model in which increased fragmentation of tissue-derived DNA oc-curs in transit to the blood.
(D) Histograms of mean cfCAR19 DNA fragment lengths for samples with low (dark blue) and high (light blue) CAR19 FACS over n = 1,000 random samplings of cfCAR19 DNA fragments.
(E) Cumulative frequency of cfCAR19 fragments shorter than a given length in three temporal bins following CAR19 infusion: week 1, week 4, and > week 4. Bins compared using the Kolmogorov-Smirnov (K-S) test, and p values are indicated in the table.
(F) Correlation between cfTCR levels measured by SABER and cfCAR19 levels 1 week after CAR19 infusion (dark green), and 4 weeks following CAR19 infusion (light green) using samples from patients in the discovery cohort. Correlation coefficients were compared using Fisher’s z-transformation. Prog., progressor; O. Resp., ongoing responder; ND, not detected; FACS, fluorescence-activated cell sorting. *p < 0.05. See also Figure S2.

