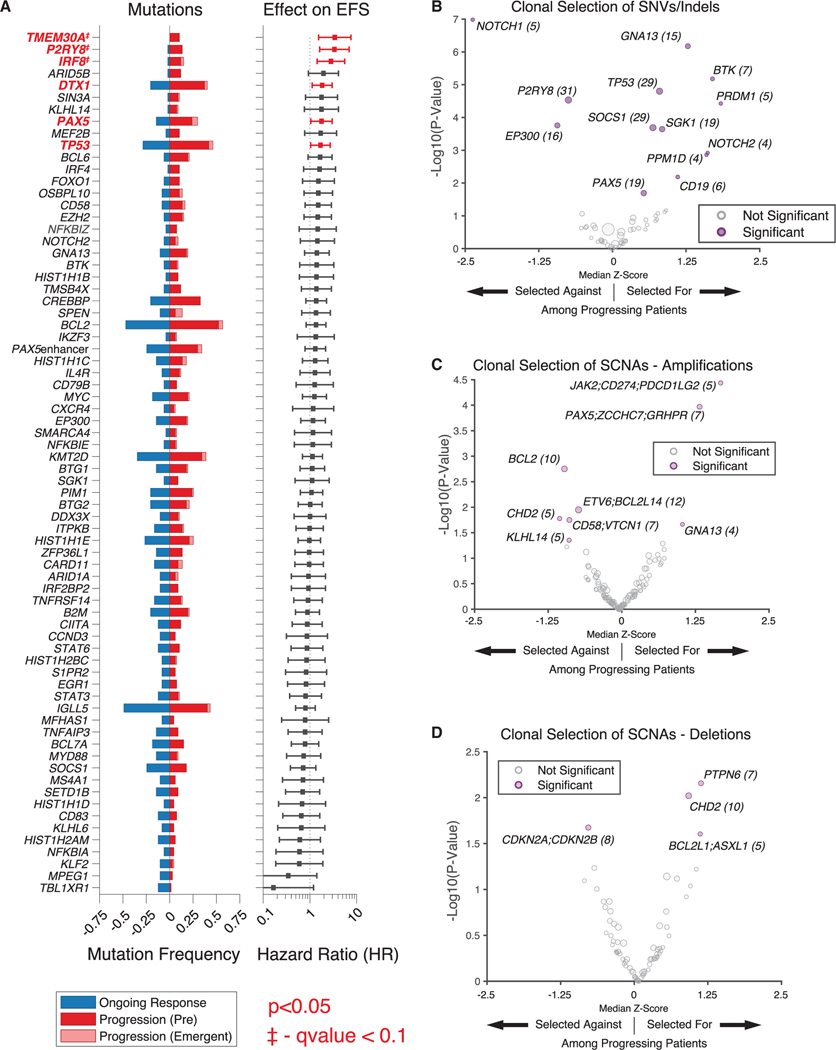
Figure 4. Genomic determinants of resistance to CAR19 therapy.
(A) (Left) Recurrently mutated genes in patients receiving CAR19 therapy, stratified by ongoing response versus progression among pooled patients from the discovery and validation cohorts. (Right) Effect of mutations in given gene on EFS (HR from proportional hazard model); significant values (p < 0.05) shown in red.
The proportion of emergent mutations is depicted in light red. Genes that remained statistically significant after adjusting for multiple hypothesis testing (Benjamini-Hochberg method, q < 0.1) are annotated. Genes mutated in greater than 5% of patients pre-CAR19 are displayed.
(B) Clonal selection of mutations in specific genes in patients experiencing disease progression shown as a volcano plot. Mutated genes under significant selection are shown on the right in purple; size of dot proportional to number of mutations (also shown in parentheses).
(C and D) Clonal selection of somatic copy-number alterations (SCNAs)—amplifications (C) and deletions (D)—at the level individual genes, in patients experiencing progression shown as a volcano plot. Genes listed in groups that are included in single 500-kb regions. SCNAs under significant selection are shown in purple; size of dot proportional to number of SCNAs (also shown in parentheses). HRSNV, single-nucleotide variant; indel, small insertions/deletions. *p < 0.05.
See also Figure S3.

