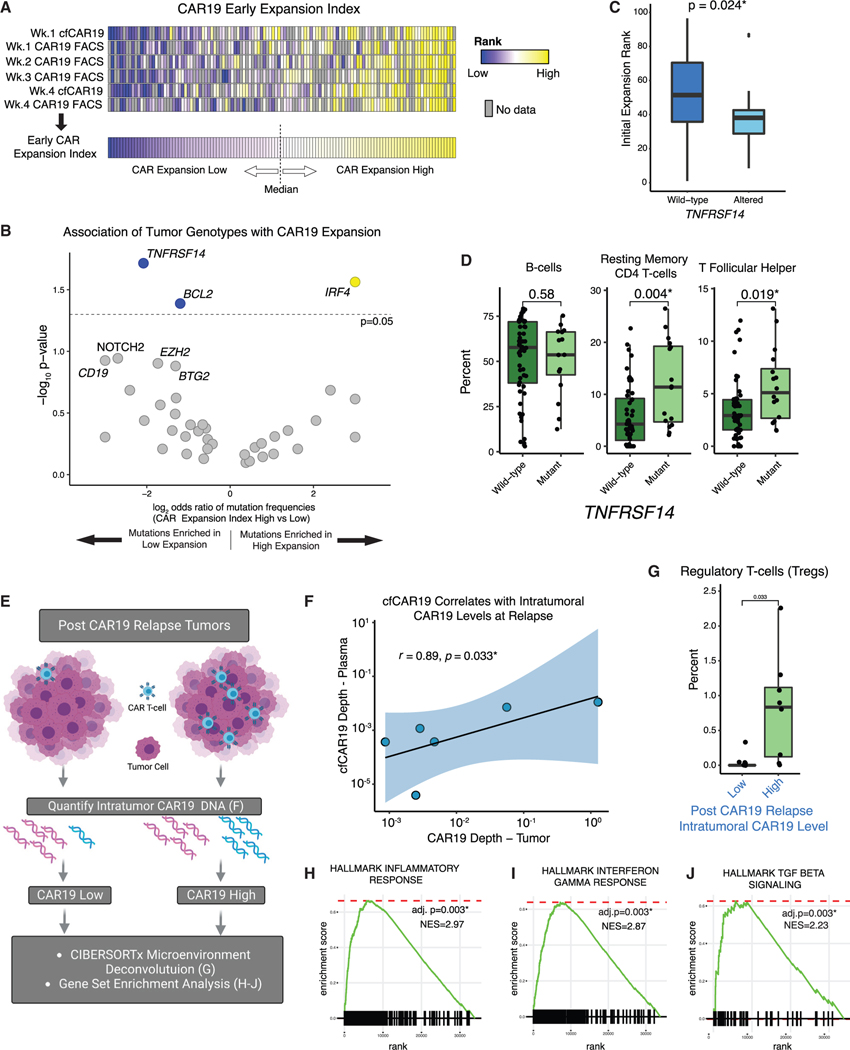
Figure 6. Reciprocal interactions between tumor and CAR T cells influence CAR19 expansion and tumor microenvironment.
(A) Overview of schema used to calculate the early CAR19 expansion index for each patient (see STAR Methods for detail). Patients greater than or equal to the median expansion rank were considered to have a high early CAR19 expansion index, and those below the median were considered to have a low early expansion index. Gray boxes indicate sample time points with no available data.
(B) Enrichment of genomic alterations in individual genes in patients with high and low initial CAR expansion as determined using early CAR19 expansion index,depicted as a volcano plot. Genes significantly associated with expansion are colored blue (enriched in low expansion) or yellow (enriched in high expansion).
(C) Comparison of early CAR19 expansion as quantified using the early CAR19 expansion index in TNFRSF14-mutated (light blue) versus wild-type (dark blue) patients.
(D) Comparison of select immune cell subsets in pre-CAR19 r/rLBCL tumors (n = 68) as inferred using CIBERSORTx in TNFRSF14-mutated (light green) and wild-type (dark green) tumors.
(E) Intratumoral CAR19 T cell levels in post-CAR19 relapse tumors were quantified using CAPP-seq. Gene expression and tumor immune microenvironment composition were compared between tumors with high versus low relapse CAR19 levels.
(F) Correlation between intratumoral CAR19 levels (CAR19 depth/total sequencing depth, x axis) versus matched plasma cfCAR19 levels (CAR19 depth/total sequencing depth, y axis) in six cases with both available matched plasma and tumor samples at the time of relapse.
(G) Comparison of regulatory T cell levels as measured using CIBERSORTx in post-CAR19 relapse tumors (n = 14) with high versus low intratumoral axi-cel levels(stratified to cohort-wise median).
(H–J) Gene set enrichment analysis (GSEA) enrichment plots demonstrating enrichment of (H) inflammatory, (I) interferon gamma, and (J) TGF-β gene sets in post-CAR19 relapsed tumors (n = 14) with high versus low axi-cel content (stratified to cohort-wise median). GSEA*p < 0.05. See also Figures S5 and S6.

