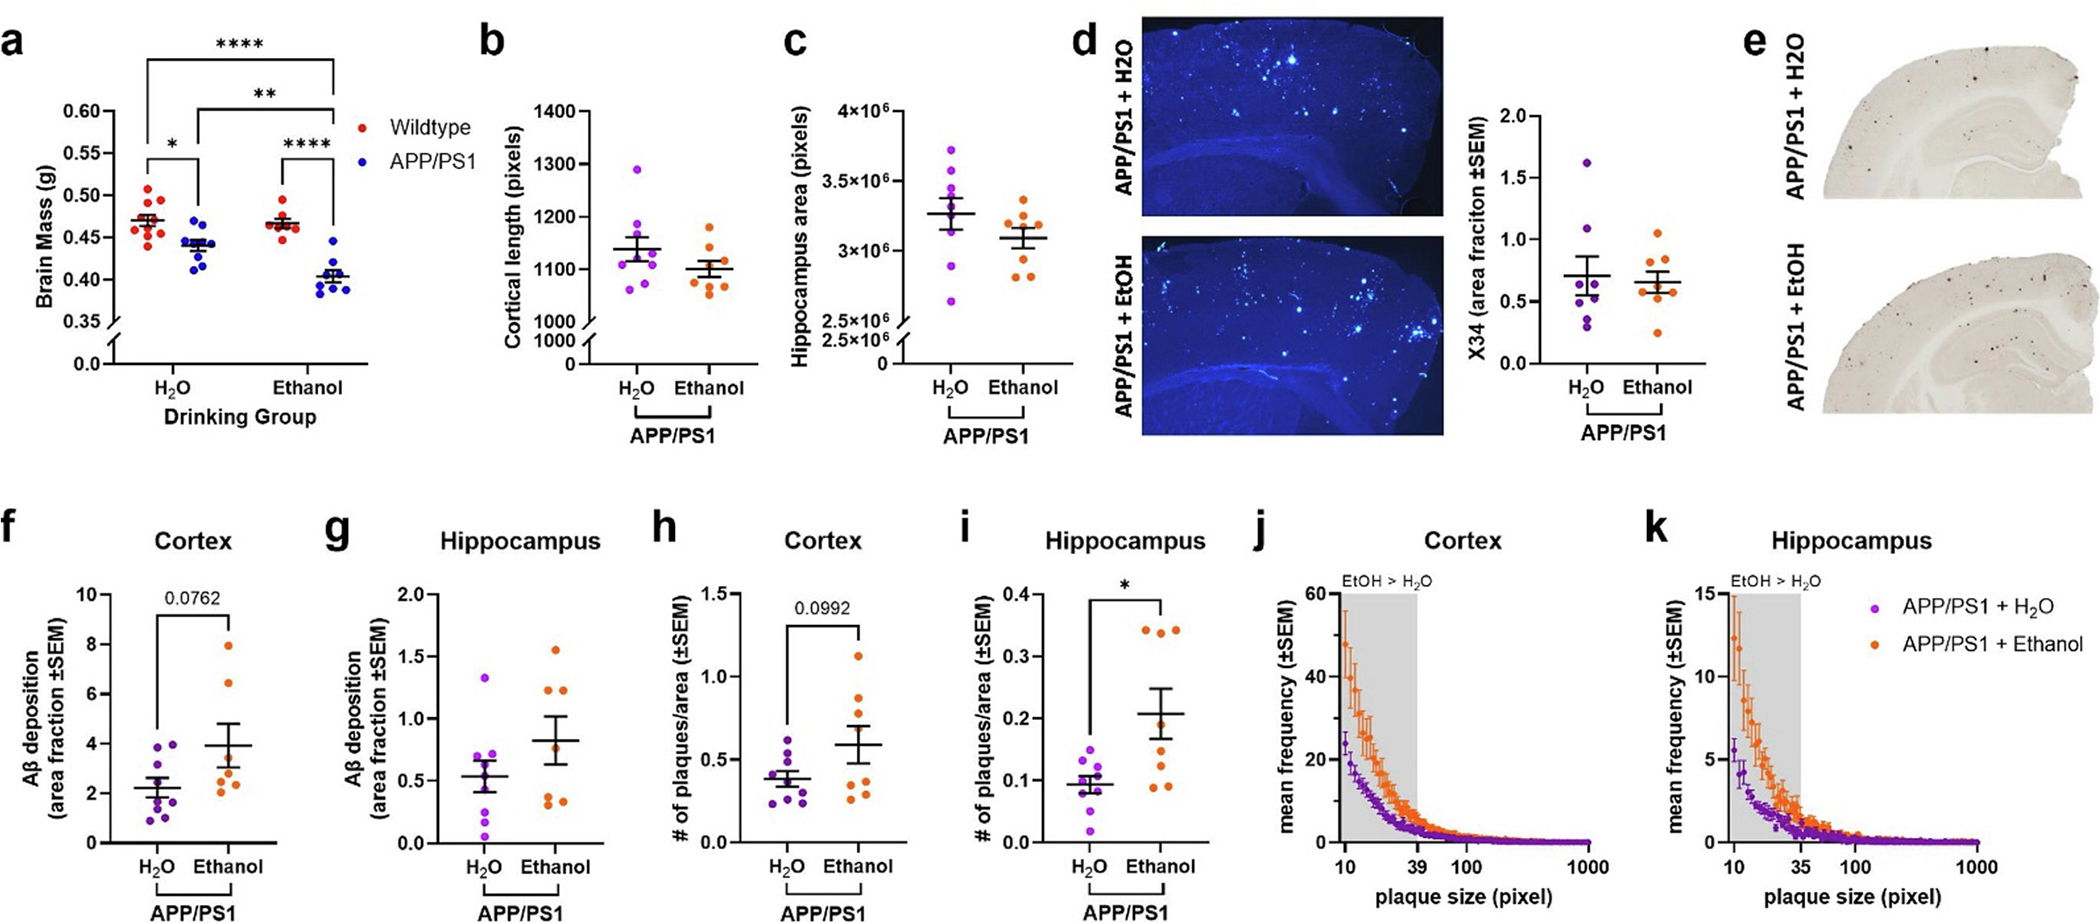
Fig. 2.

Ethanol exposure increases brain atrophy and amyloid pathology in APP/PS1 mice. a) Brain atrophy was increased in H2O-exposed APP/PS1 mice (p < 0.05), an effect that was exacerbated in ethanol-exposed APP/PS1 mice (p < 0.01). b) Cortical thickness was comparable between H2O- and ethanol-exposed APP/PS1 mice. c) Hippocampal volume was comparable between H2O- and ethanol-exposed APP/PS1 mice. d) Representative images of X34 staining in cortex of H2O- and ethanol-exposed APP/PS1 mice. There were no differences in X34+ amyloid plaques was found. e) Representative images of Aβ deposition in the cortex and hippocampus of H2O- and ethanol-exposed APP/PS1 mice. f) Ethanol-exposed APP/PS1 mice showed a trend towards increased Aβ deposition in the cortex compared to H2O-exposed APP/PS1 mice (p = 0.0762). g) No change in Aβ deposition in the hippocampus of H2O- and ethanol-exposed APP/PS1 mice. h) Ethanol-treated APP/PS1 mice had a trend towards increased cortical plaque number compared to H2O-exposed APP/PS1 mice (p = 0.0992). i) Ethanol-exposed APP/PS1 mice had increased hippocampal plaque number compared to H2O-exposed APP/PS1 mice (p < 0.05). j) Frequency distribution of cortical amyloid plaque size (in pixels). Ethanol-exposed APP/PS1 mice had more smaller plaques in the cortex compared to H2O-exposed APP/PS1 mice. k) Frequency distribution of hippocampal amyloid plaque size (in pixels). Ethanol-exposed APP/PS1 mice had more smaller plaques in the hippocampus compared to H2O-exposed APP/PS1 mice. Wildtype + H2O, n = 10; APP/PS1 + H2O, n = 9; Wildtype + EtOH, n = 7; APP/PS1 + EtOH, n = 8. *p < 0.05, **p < 0.01, ****p < 0.0001.
