
Fig. 2.
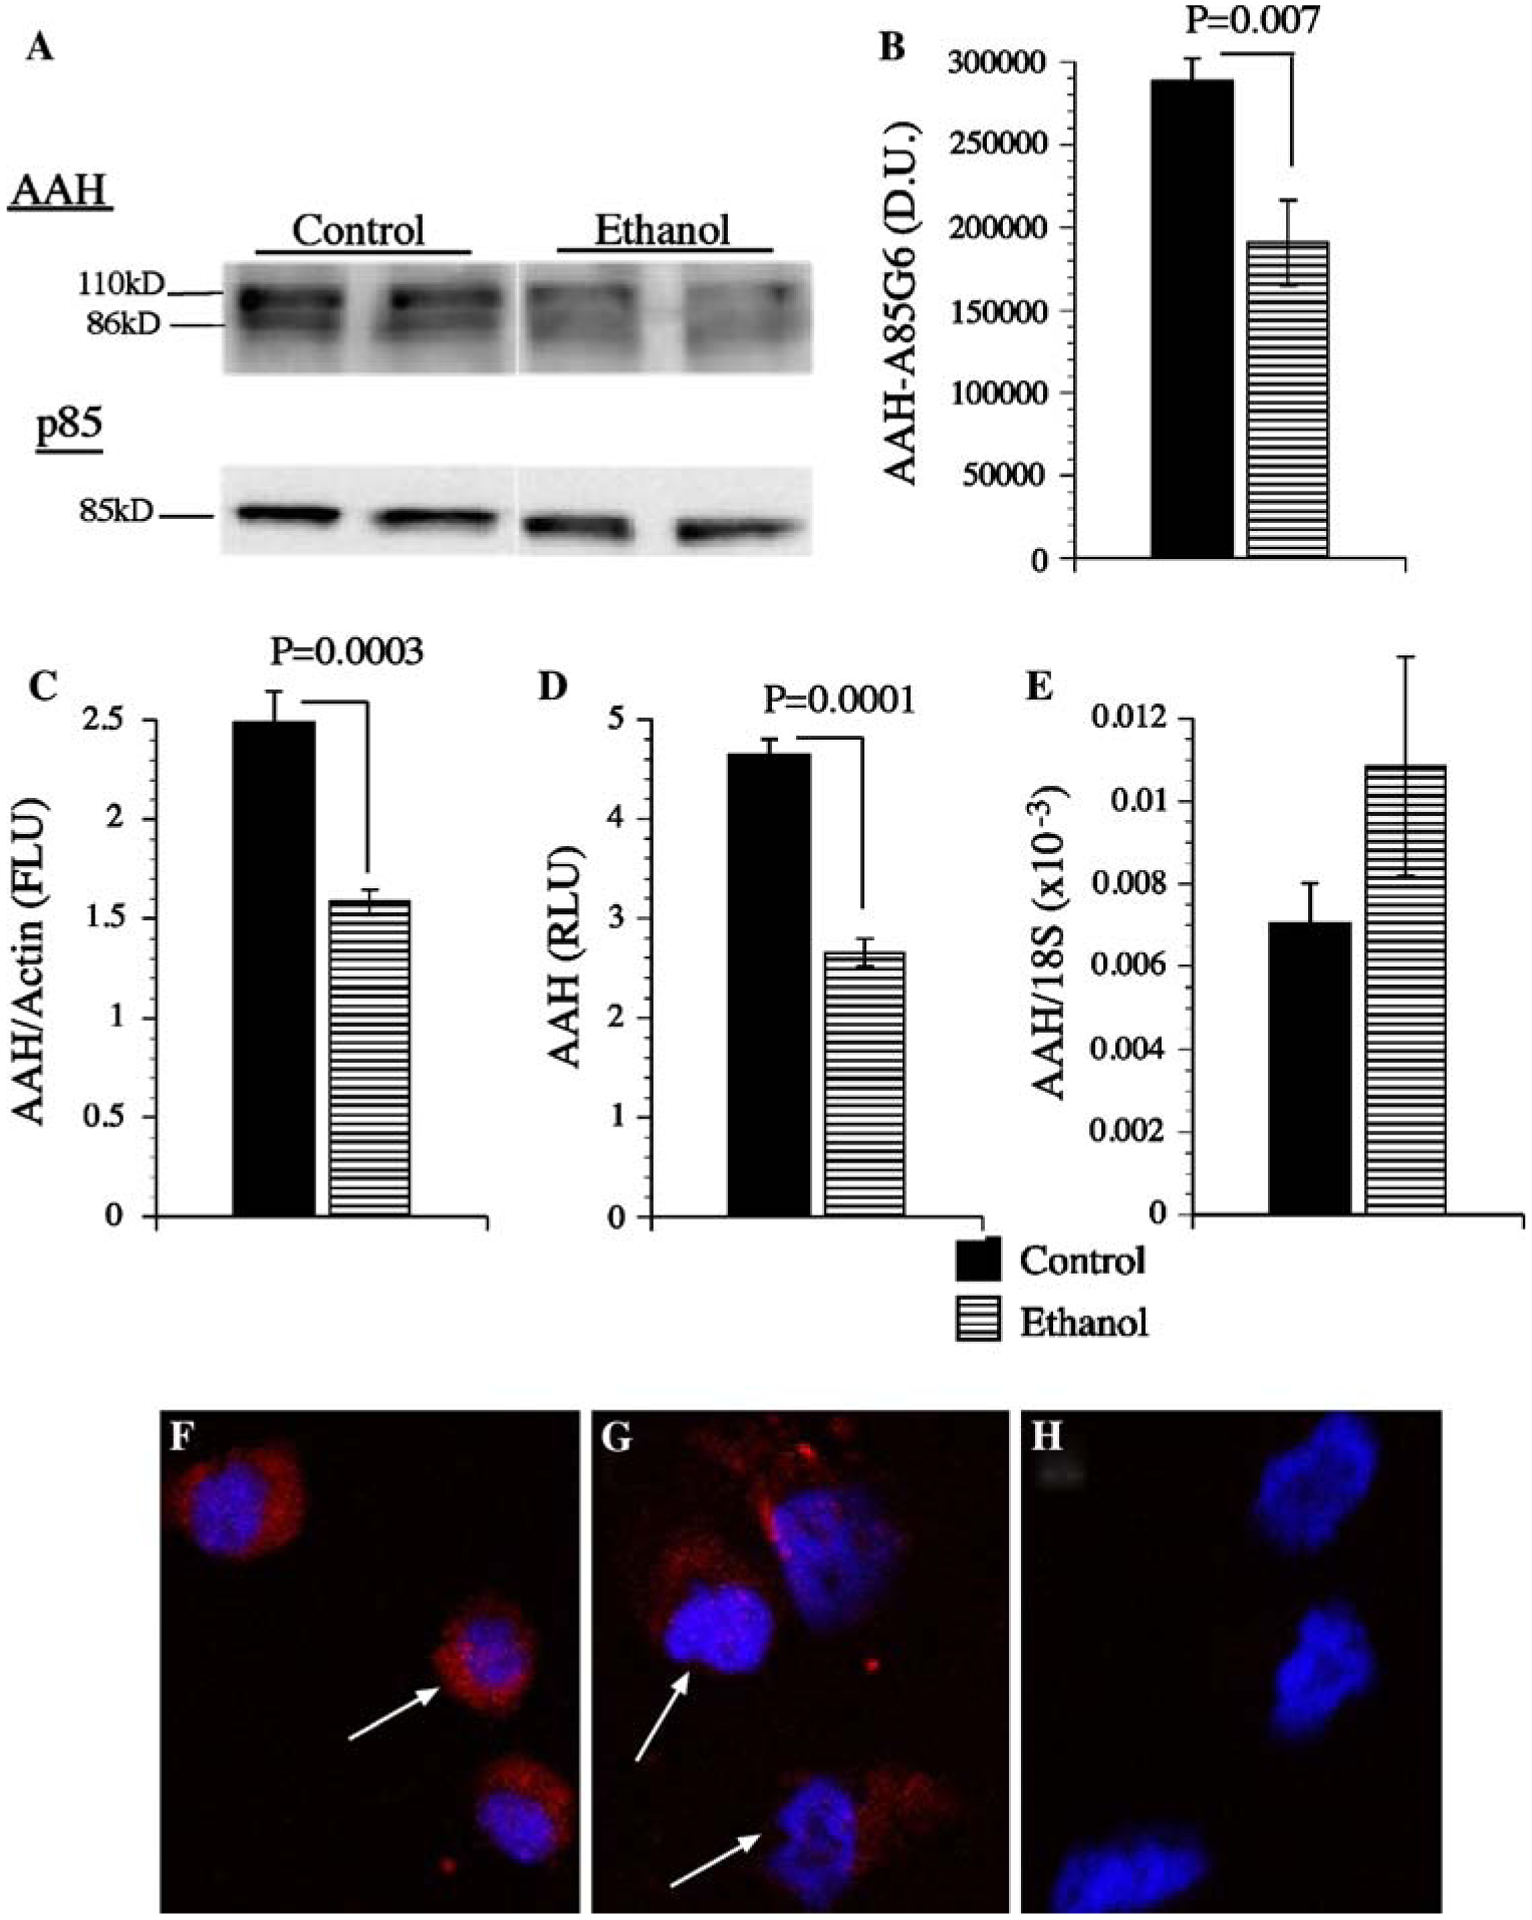
Ethanol inhibits AAH Expression. PNET2 neuronal cells were treated with 100 mM ethanol or vehicle for 96 h. During the last 24 h of treatment, cells were stimulated with 10 nM IGF-1 in serum-free medium. a AAH was detected by Western blot analysis (~86 and ~110 kD) using the A85G6 mAb. Blots were stripped and re-probed for the p85 subunit of PI3 kinase as a loading control. b Digital image quantification of the mean (±SEM) AAH protein levels detected by Western blot analysis (N = 6 per group). IGF-I stimulated AAH expression demonstrated by c ELISA, d cellular ELISA, e qRT-PCR, or f–h immunofluorescence. Graphs depict group means ± SEM, and significant inter-group differences are indicated by P-values over the graphs. In panels f and g, AAH immunoreactivity is shown in red, and nuclei counterstained with DAPI are shown in blue. Panel h represents a negative control study in which the non-relevant mAb to Hepatitis B virus was used instead of the AAH mAb. Cells were imaged by confocal microscopy