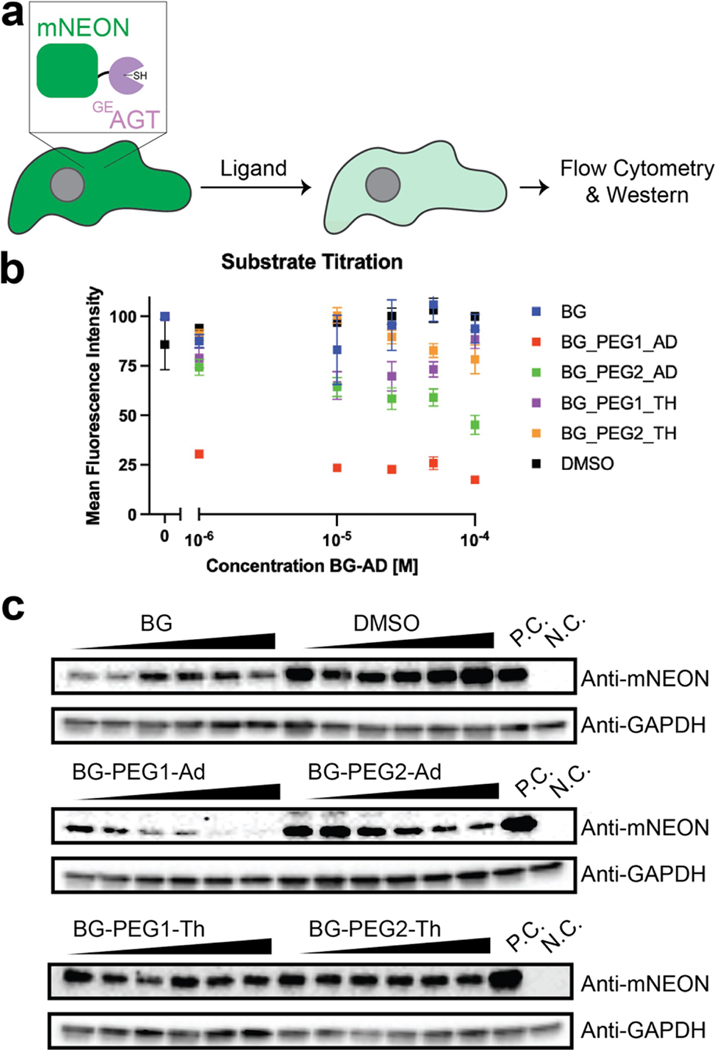
Figure 2.
Validation of various BG ligands for protein degradation. a. Schematic of BG ligand binding to GEAGT and inducing degradation of both the protein and fluorescent reporter. b. Normalized flow cytometry data based on the mean fluorescent shift of the mNeonGreen reporter. Cells were treated for 24 h and ligand concentration is noted in the x-axis. N=3. FACS results were gated against fluorescence and differences in cell populations above selected gates were used to calculate mean fluorescence intensity. c. Western blot of various BG ligands. Cells were treated for 24 h and the concentration of ligands increased from 0.5 uM to 50 uM. P.C.=positive control; plasmid transfection of the mNeonGreen reporter without vehicle or small molecule exposure. N.C.=negative control; no plasmid transfection of the mNeonGreen reporter.

