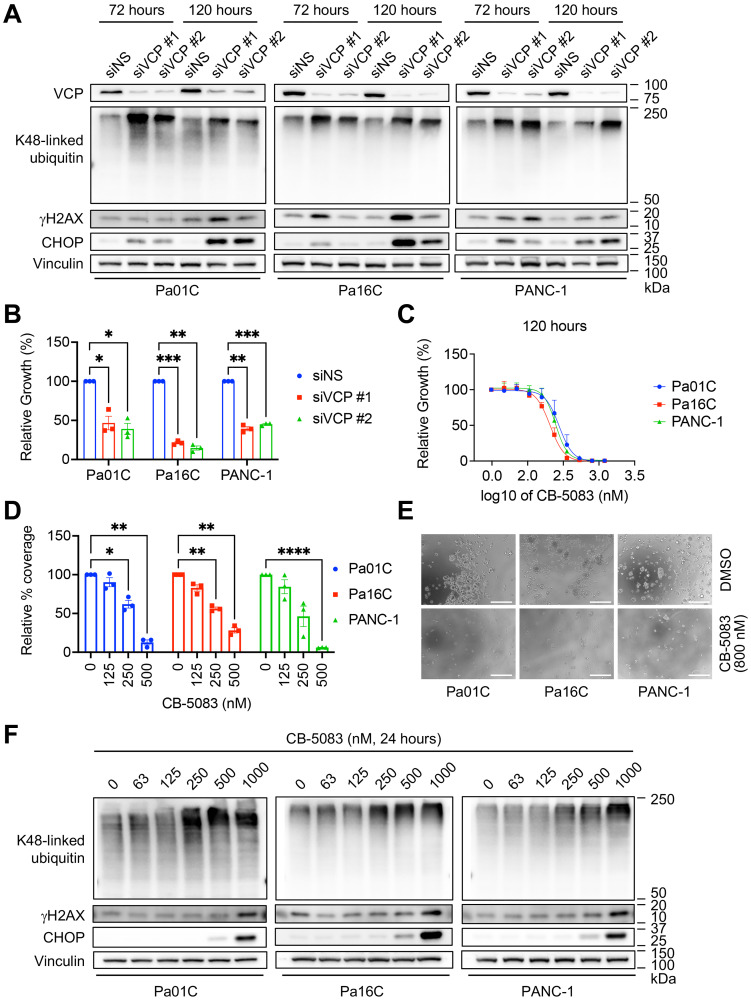
Figure 2. VCP is required for PDAC growth and polyubiquitinated protein degradation.
(A) To determine the consequences of loss of VCP expression for the degradation of polyubiquitinated proteins, cells were reverse transfected for 72 and 120 hours with siNS, siVCP #1, or siVCP #2. Protein lysates were collected and immunoblot analyses were performed to determine the levels of K48-linked ubiquitin, γH2AX and CHOP. Vinculin served as a loading control. Figure is representative of three biological replicates. (B) To determine the importance of VCP to anchorage-dependent proliferation, cells were transiently transfected for 120 hours with siNS, siVCP #1, or siVCP #2. Proliferation was assessed at 120 hours by live cell counting. Mean cell counts were normalized to siNS control. Data shown are the mean ± SEM of three independent experiments. Two-way ANOVA followed by Dunnett’s multiple comparison test was used to determine statistical significance between the different groups. *p < 0.05, **p < 0.005, ***p ≤ 0.0005. Degree of knockdown is shown in Supplementary Figure 1B. (C) Cells were treated with a range of VCP inhibitor (CB-5083) concentrations (47–1200 nM) and proliferation was assessed at 120 hours by live cell counting. Data shown are the mean ± SEM of three independent experiments. (D) Anchorage-dependent colony-forming capacity was evaluated by staining with crystal violet after 10–14 days of treatment with vehicle control (0 nM CB-5083) or CB-5083 (125, 250, or 500 nM). Relative percent coverage was normalized to DMSO. Data shown are the mean ± SEM of three independent experiments. Two-way ANOVA followed by Dunnett’s multiple comparison test was used to determine statistical significance between the different groups. *p < 0.05, **p < 0.005, ***p < 0.0001. (E) Anchorage-independent growth was determined by 3D colony formation in soft agar. Cells were seeded into agar, treated with a range of concentrations of CB-5083 for 14 days and imaged on an EVOS microscope. Images are representative of three biological replicates, each of which included three technical replicates. Images of intermediate inhibitor concentrations are depicted in Supplementary Figure 1K. Scale bar, 300 μm. (F) Cells were treated with VCP inhibitor CB-5083 for 24 hours, protein lysates were collected, and immunoblot analyses were performed to determine the levels of indicated proteins as in panel A. Figure is representative of three biological replicates.

