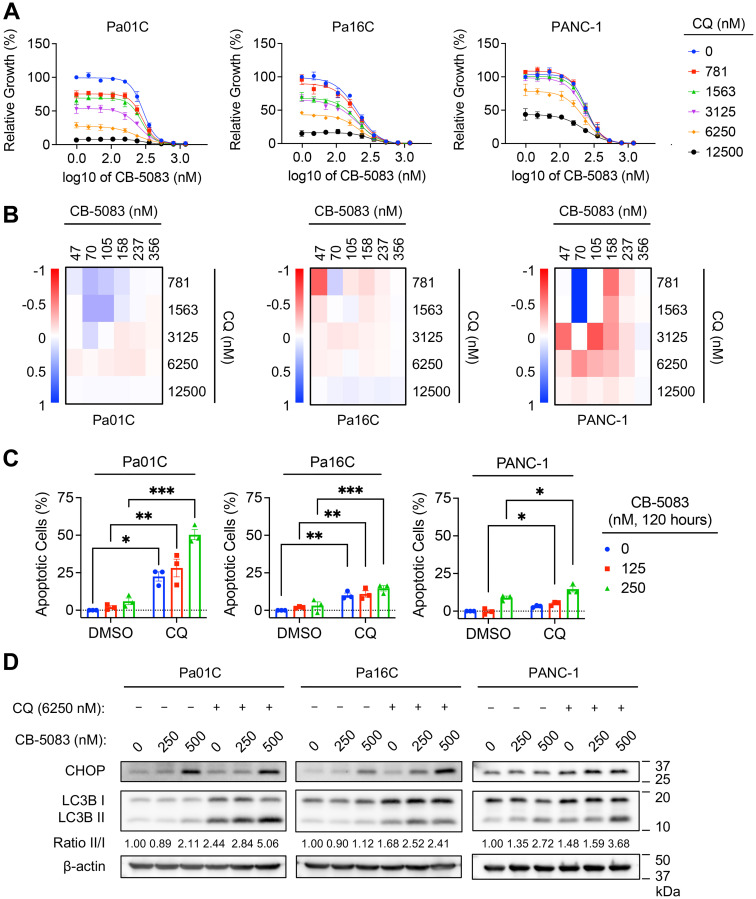
Figure 6. Dual inhibition of VCP and autophagy enhances growth suppression and apoptosis.
(A) Cells were treated with a range of VCP inhibitor concentrations (CB-5083, 47–1,200 nM) and various constant concentrations of autophagy inhibitor CQ (781, 1563, 3125, 6250, 12500 nM). Proliferation was assessed by live cell counting. Data shown are the mean ± SEM of three independent experiments. (B) Heatmaps represent Bliss independence scores corresponding to representative growth curves shown in panel A. Bliss scores less than one (red) are synergistic, greater than one (blue) are antagonistic, and zero (white) indicates additivity. (C) Cells were treated with CB-5083 (125 or 250 nM) and CQ (6250 nM) for 120 hours. Percentage of cells undergoing apoptosis was determined by FACS analysis of Annexin-V and propidium iodide-labeled cells. All treated populations were normalized to their respective controls. Data shown are the mean ± SEM of three independent experiments. Two-way ANOVA followed by Šídák’s multiple comparisons test was used to determine statistical significance. *p < 0.05, **p < 0.005, and ***p < 0.001. (D) Cells were treated with VCP inhibitor CB-5083 (250 or 500 nM), autophagy inhibitor chloroquine (CQ, 6250 nM), or a combination of CB-5083 and CQ for 72 hours at the indicated concentrations. Immunoblot analyses were performed to determine levels of the indicated proteins. Autophagic flux was quantified using the ratio of LC3B-II to LC3B-I. Data shown are representative of three biological replicates.

