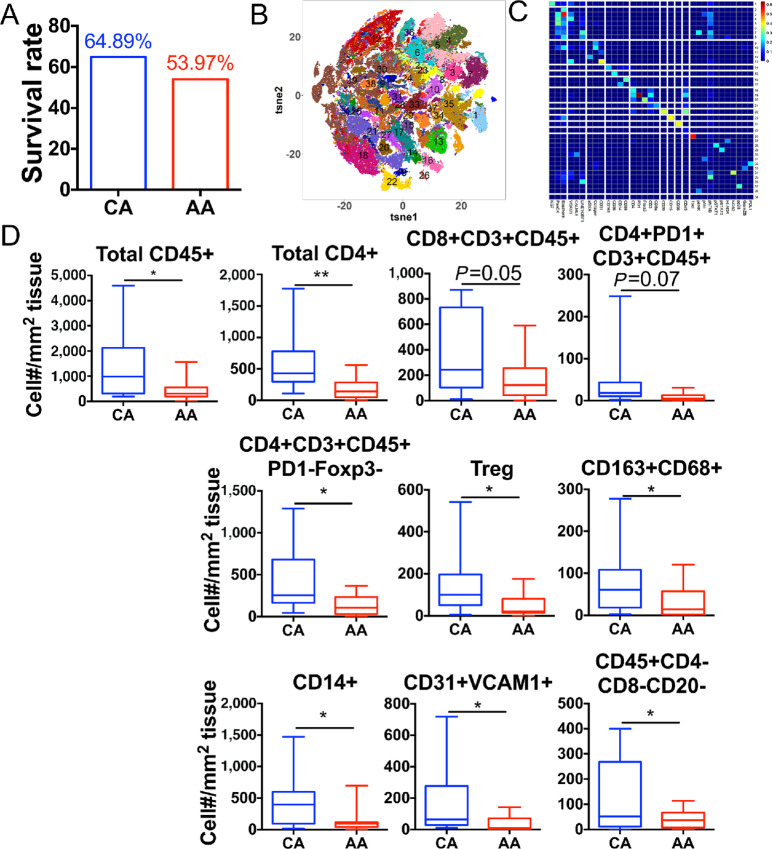
FIGURE 2.
Immune microenvironment in NSCLC is distinct between patients of different racial backgrounds. A, Lung cancer patient survival rate from a cohort of 157 patients segregated by race. Imaging mass cytometry was performed on 26 samples (12 AA and 14 CA patients) to generate tSNE plot (B), phenograph heatmap (C), and cell density of different populations (D). B, Number on tSNE indicates the clusters identified. C,X axis shows the 35 markers used in Supplementary Table S1. Y axis shows the 38 populations (Table 2) identified. Unpaired Student t test. *, P < 0.05. **, P < 0.01.

