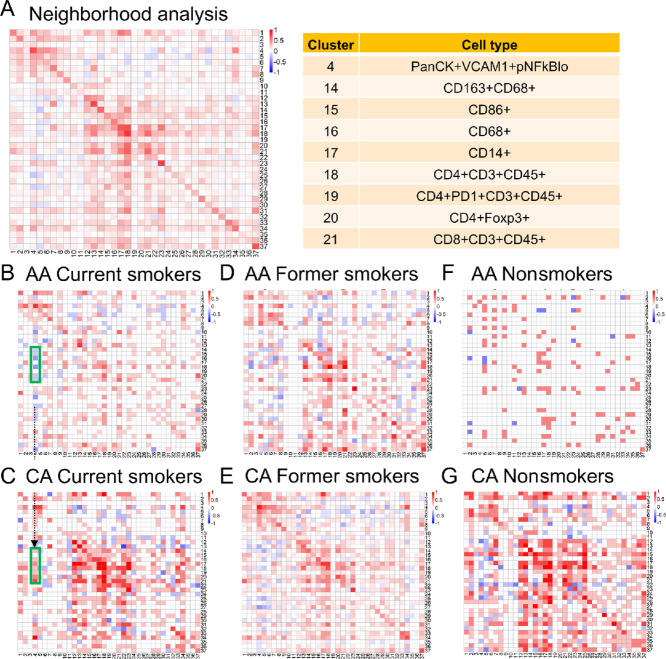
FIGURE 4.
Neighborhood analysis reveals the spatial relationship between different cell populations within patient tumor tissue. Each block represents clusters that on the X axis are surrounded (colored in red) or avoided (colored in blue) by clusters on the Y axis. All patients were clustered for analysis (A) and then separated for CA (C, E, G) and AA patients (B, D, F) based on their smoking histories. B and C: current smokers. D and E: former smokers. F and G: nonsmokers. Selected cell clusters are presented in A. Highlighted clusters within green boxes indicate the different spatial relationship between selected immune cell clusters (A) and cancer cells in AA (B, avoidance) and CA patients (C, surrounding).

