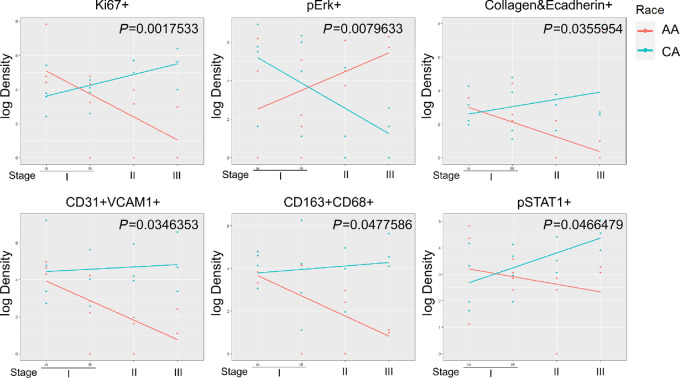
FIGURE 5.
Correlation between cell clusters and disease stages in AA and CA patients are different. The cell density of each cluster at different disease stages was plotted in a log scale. Linear regression was used to fit each cluster (CA: cyan line, AA: red line). Clusters with significant P values (P < 0.05) between CA and AA patients were presented.

