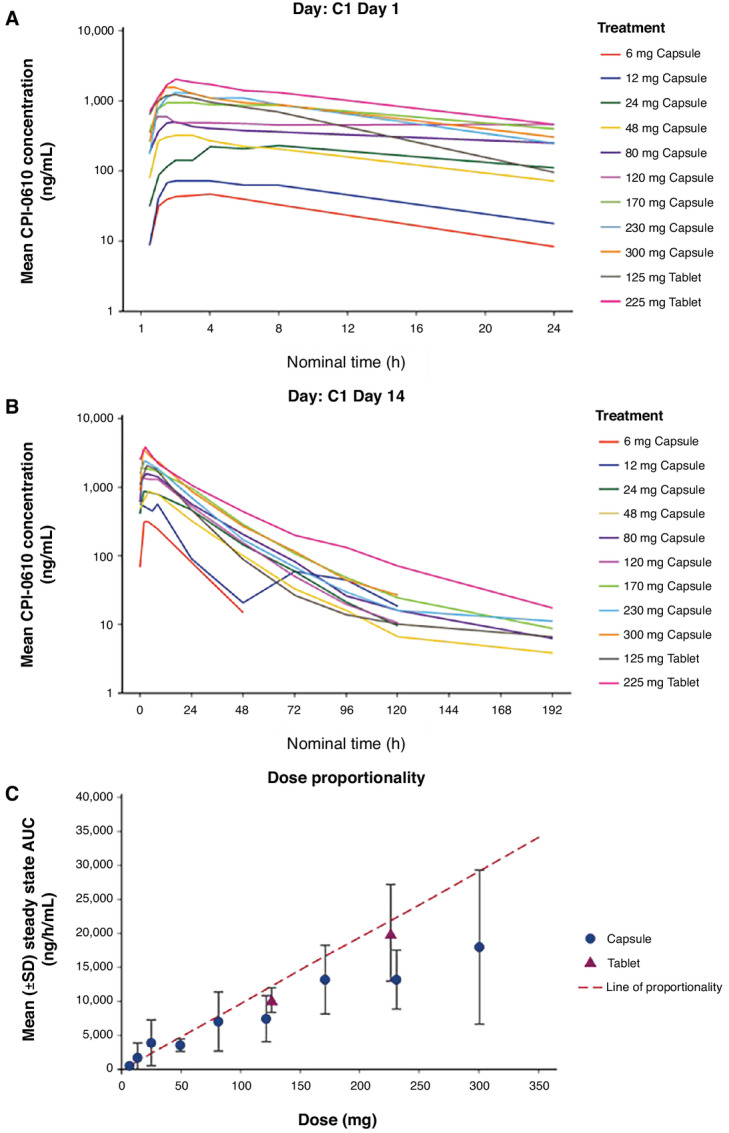
FIGURE 2.

Mean pelabresib plasma profiles and dose proportionality. A, Mean pelabresib plasma profile over time at Cycle 1 Day 1. B, Mean pelabresib plasma profile over time at Cycle 1 Day 14. C, Dose proportionality of mean steady-state AUC of patients treated with capsule and tablet doses of pelabresib. Subjects receiving a dose other than the planned dose were excluded from the calculation of concentration summary statistics; Predose/negative nominal time were set to 0.
