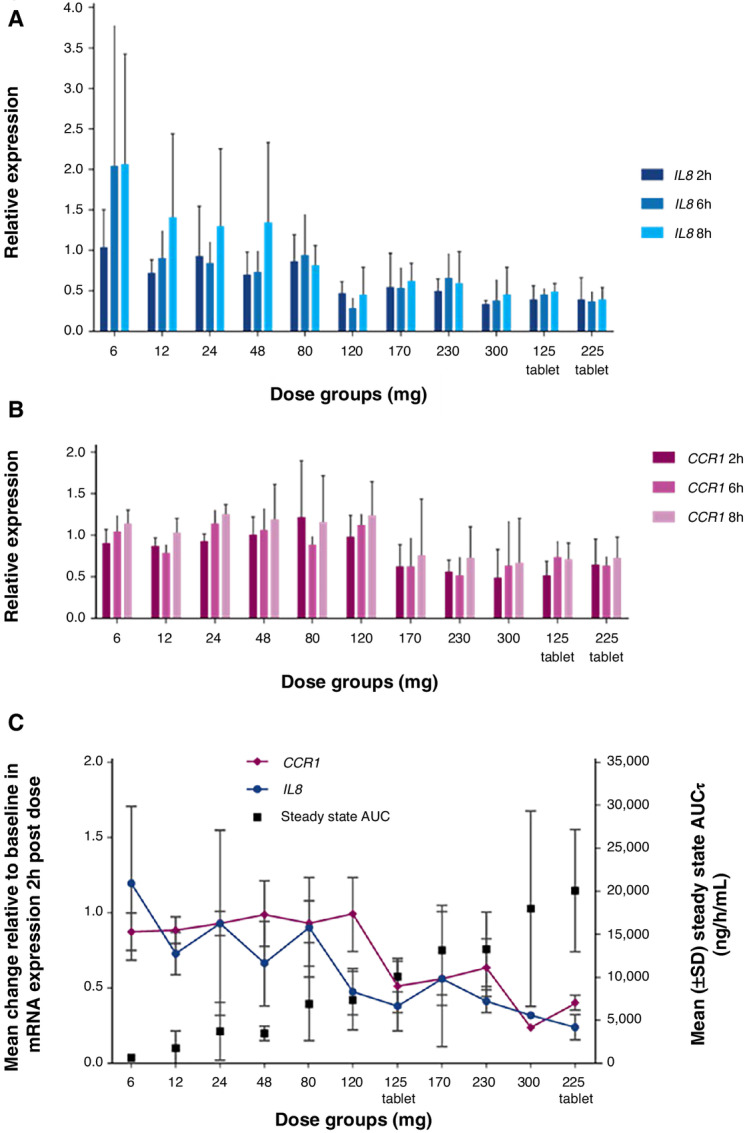
FIGURE 3.

Gene expression analysis of IL8 and CCR1 transcript levels after treatment with pelabresib. A, Relative expression of IL8 blood mRNA levels prior to and 2, 6, and 8 hours after pelabresib treatment. B, Relative expression of CCR1 blood mRNA levels prior to and 2, 6, and 8 hours after pelabresib treatment. Relative mRNA expression of IL8 and CCR1 after dosing is shown relative to the pretreatment values (y axis). C, Relative IL8 and CCR1 mRNA expression compared to the Cycle 1 Day 14 steady-state AUC. IL8 and CCR1 are represented as the average at the 2-hour time point following pelabresib administration over that of baseline in each dose group. The steady state (C1D14) AUC0–24 (hour/ng/mL, geometric mean of each dose level) is shown on the right y axis. T = tablet 125 mg and 225 mg were tablet formulations; all other doses were capsule formulation.
