FIGURE 2.
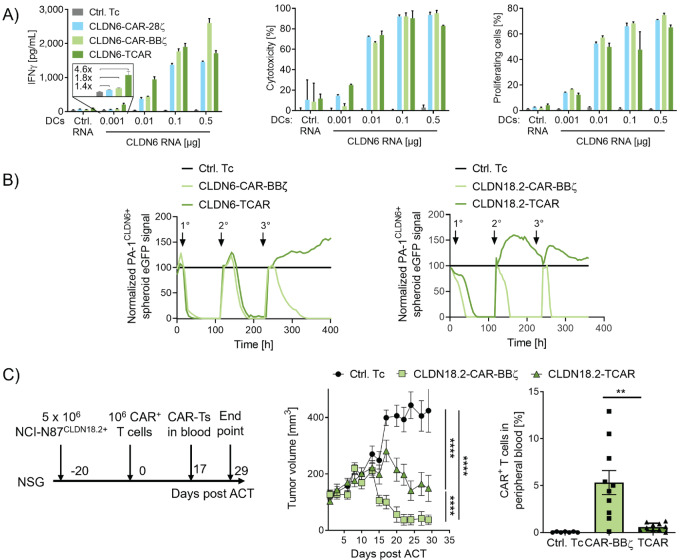
TCAR mediates highly sensitive antigen recognition and antitumor function. A, IFNγ secretion (left), cytotoxicity (middle), and proliferation (right) of CLDN6-TCAR– or CLDN6-CAR–expressing human CD8+ T cells cocultured with CLDN6+ DCs [E:T ratio = 10:1 (left and middle) or 20:1 (right)]. IFNγ concentrations in culture supernatants were determined after 20 hours of coculture by IFNγ ELISA. Cytotoxicity and proliferation of CLDN6-TCAR and CAR T cells was assessed by luciferase-based cytotoxicity and CFSE proliferation assays. T cells transfected with Cα RNA only (Ctrl. Tc), and DCs transfected with CLDN18.2 RNA (Ctrl. RNA) were used as negative controls. Graphs show mean + SD of technical duplicates (left, right) or triplicates (middle) representative for 3 blood donors. B, Serial killing of human CLDN6+ or CLDN18.2+ PA-1 tumor spheroids by CLDN6- (left) or CLDN18.2- (right) TCAR/CAR-transduced CD3+ T cells analyzed by eGFP real-time imaging (E:T = 30:1). Nontransduced cells (Ctrl. Tc, left) or CD19-CAR-BBζ transduced T cells (Ctrl. Tc, right) were used as controls. Arrows indicate addition of tumor spheroids. Mean of technical triplicates is shown. C, NSG mice with subcutaneous NCI-N87CLDN18.2+ xenografts were treated with human TCAR/CAR-transduced T cells (106 cells/animal, 10 mice/group) or nontransduced T cells (Ctrl. Tc; 10 mice/group; left) at a mean volume of 98 mm3. Tumor growth kinetics (middle) and TCAR+/CAR+ T-cell frequency in peripheral blood 17 days post ACT (right) as analyzed by flow cytometry. Graphs show mean + SEM of biological replicates. Two-way ANOVA analysis with Sidak posttest were used to test for statistical significance. **, P ≤ 0.01; ****, P ≤ 0.0001.

