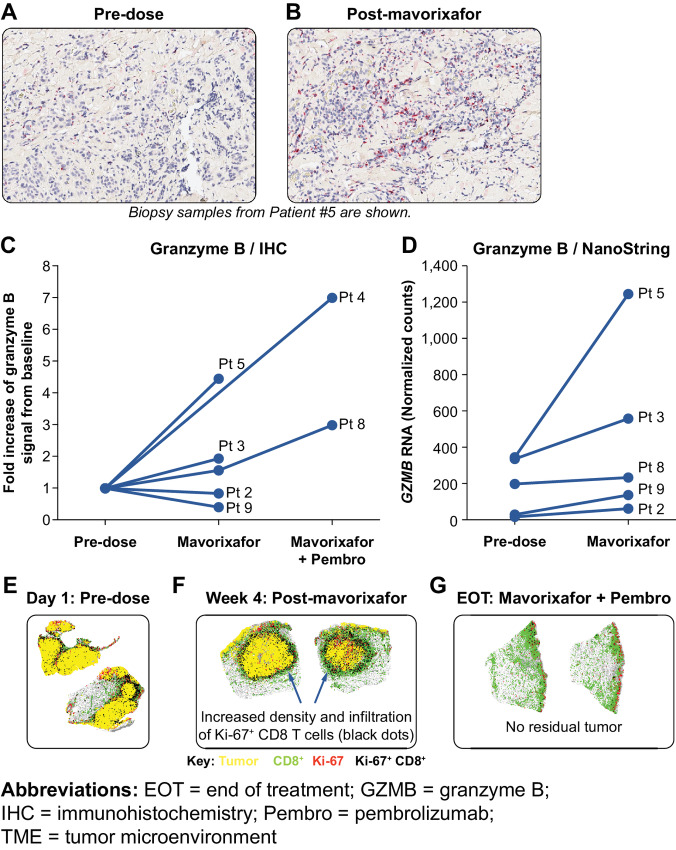
FIGURE 3.
Mavorixafor-activated immune cell activities in TME. IHC labeling for granzyme B at predose (A) and postdose timepoints (B). The fold change of granzyme B positivity posttreatment for all evaluable samples (C). Quantification was performed using HALO software and the entire tumor area was scored. RNA expression levels for GZMB for 5 patients with both pre- and post-mavorixafor monotherapy treatment-evaluable biopsies (D). Data shown (C and D) is from all evaluable patient samples available at the time of analysis. Biopsies of melanoma lesions from patient #5 stained by mIF for CD8+ cells, Ki-67 (proliferating cells), and a cocktail of melanoma-specific antibodies to label tumor (E--G). Images represent the graphical output from the nearest-neighbor analysis module, with unlabeled cells rendered as gray.

