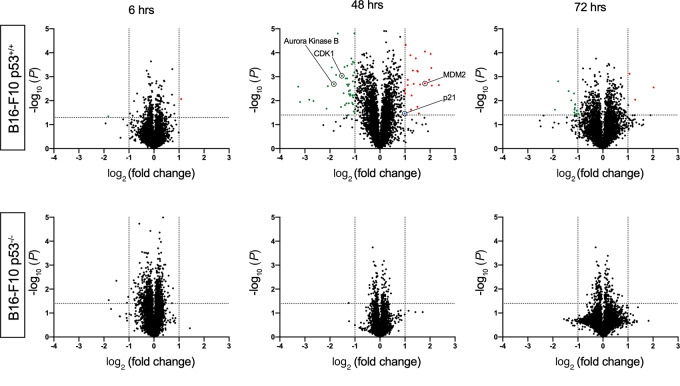
FIGURE 2.
Proteomic analysis reveal on target nature of Navtemadlin. Changes in protein expression of B16-F10 p53+/+ (top) and p53−/− (bottom) cells treated with 1.5 μmol/L Navtemadlin for 6, 48, and 72 hours was studied using mass spectrometry–based proteomics analysis. Proteins significantly upregulated are depicted in red and those that are downregulated in green. One experiment with triplicates.

