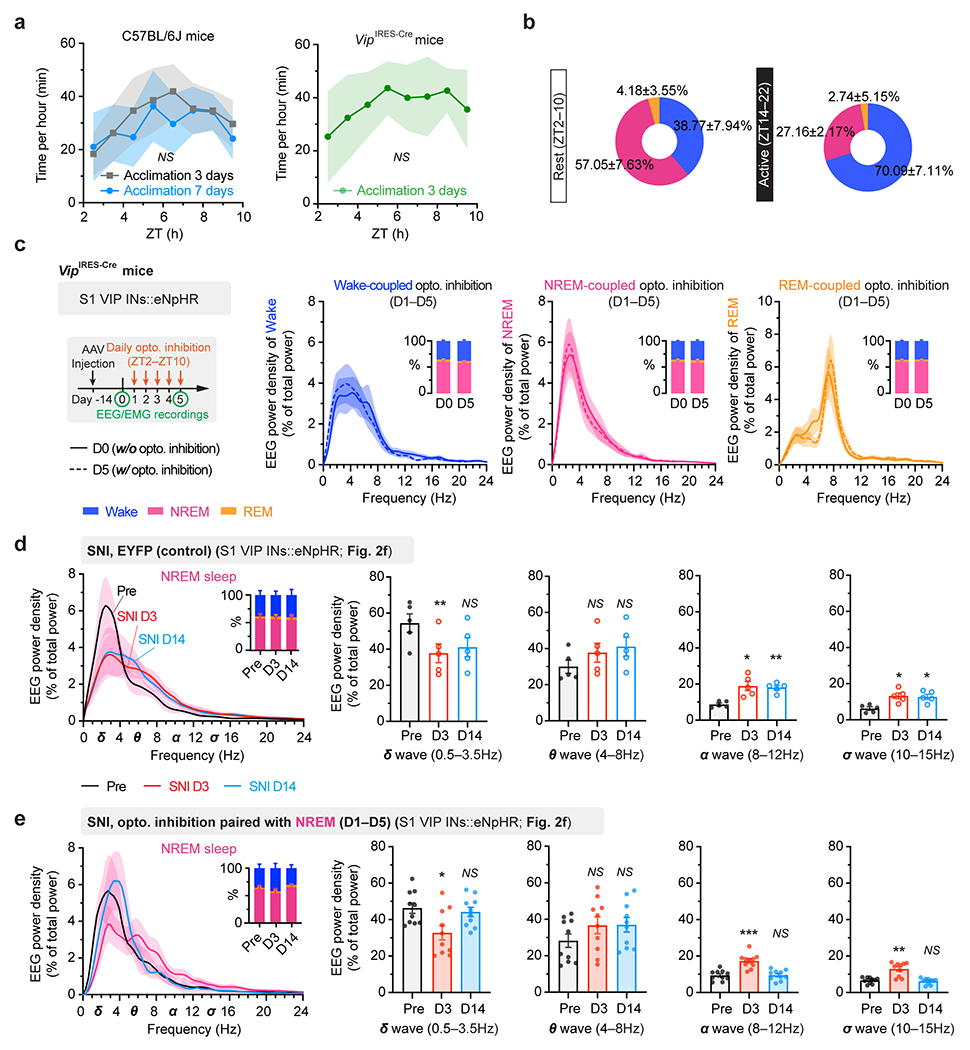
Extended Data Fig. 3. The sleep-wake structure and EEG power analysis in mice with or without neuropathic pain.

a, Mean NREM sleep distribution (n = 5 mice per group). No difference in sleep pattern following 3- or 7-day acclimation (F(7, 64) = 0.98, P = 0.45). The VIP-Cre transgene has no effect on sleep pattern (F(7, 64) = 0.26, P = 0.97 vs. C57 3-day acclimation). b, Percentages of time in wake, NREM and REM sleep during the rest and active phase of the mouse (n = 5 mice). c, EEG analysis for naïve VipIRES-Cre mice expressing eNpHR (no surgery) (n = 4 mice per group). Experimental timeline for optogenetic inhibition (left), mean EEG power density (right) and percentages of time (inset) in wake, NREM and REM sleep. VIP inhibition has no effect on EEG power intensity in wake (P = 0.68), NREM (P = 0.55) and REM (P = 0.89) sleep. d, EEG analysis for VipIRES-Cre mice expressing EYFP (n = 5 mice; related to Fig. 2f). Mean EEG power density in NREM (left) and quantification (right) before, 3 and 14 days after SNI. Inset, percentages of wake, NREM, and REM. SNI decreases the power of δ wave (P = 0.0020, 0.24 vs. Pre) and increases the power of α (P = 0.014, 0.0050) and σ waves (P = 0.016, 0.017) in NREM sleep. e, Similar to (d), but for VipIRES-Cre mice expressing eNpHR (n = 10 mice; related to Fig. 2f). Daily inhibition of VIP INs reverses alterations in NREM power density after SNI (δ, P = 0.033, 0.61; θ, 0.27, 0.20; α, 0.0001, 0.86; σ, 0.0017, 0.60 vs. Pre). Mean ± SEM. Shading in a, c, d, e, 95% CI. *P < 0.05, **P < 0.01, ***P < 0.001; NS, not significant; by two-sided two-way ANOVA (a), Mann-Whitney (c) or paired t-test (d, e). Detailed statistics in Supplementary Table 1.
