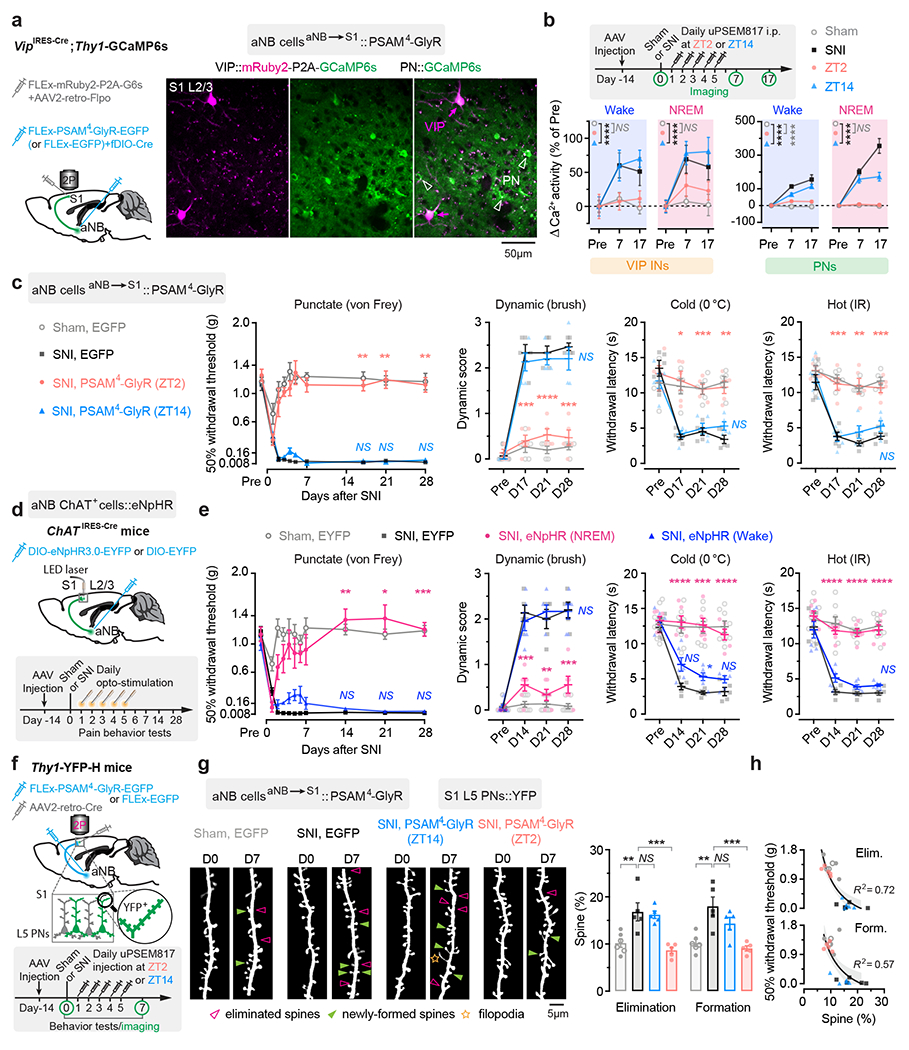
Fig. 5 |. Silencing aNB→S1 projections during NREM sleep prevents S1 plasticity and pain chronicity.

a, Experimental design for chemogenetic inhibition of aNB→S1 projections (left) and representative two-photon images of VIP INs expressing both mRuby2 and GCaMP6s and PNs expressing GCaMP6s alone. b, Experimental timeline (top) and neuronal Ca2+ activity under various conditions (bottom; VIP, n = 114/four, 92/three, 87/three, 80/four cells/mice; PNs, n = 231/four, 242/three, 228/three, 223/four cells/mice). Daily inhibition of aNB→S1 projections at ZT2 largely prevents SNI-induced VIP (ZT2 vs. sham, wake, F(1, 576) = 0.13, P = 0.72; NREM, F(1, 576) = 2.14; P = 0.14) and PN (wake, F(1, 1356) = 26.16, P < 0.0001; NREM, F(1, 1356) = 2.14, P = 0.57) hyperactivation in S1. c, Nociceptive thresholds under various conditions (n = 5 mice per group). Daily inhibition of aNB→S1 projections at ZT2 reduces punctate (P = 0.0012, 0.0073, 0.0044), dynamic (P = 0.0002, < 0.0001, 0.0002), cold (P = 0.012, 0.0007, 0.0010), and hot (P = 0.0009, 0.0038, 0.0003) allodynia 17, 21, and 28 days after SNI. d, Experimental design and timeline. e, Nociceptive thresholds under various conditions (n = 8, 5, 6, 6 mice). Daily inhibition of aNB→S1 cholinergic projections in NREM sleep reduces punctate (P = 0.0039, 0.010, 0.0007), dynamic (P = 0.0003, 0.0013, 0.0004), cold (P < 0.0001, = 0.0004, < 0.0001), and hot (P < 0.0001, < 0.0001, < 0.0001) allodynia 14, 21, and 28 days after SNI. f, Experimental design and timeline for chemogenetic inhibition of aNB→S1 projections and dendritic spine imaging in S1. g, Daily inhibition of aNB→S1 projections at ZT2, but not ZT14, reduces SNI-induced increase in dendritic spine elimination (P = 0.0041, 0.0092, > 0.99) and formation (P = 0.0017, 0.0007, 0.34) (n = 6, 5, 5, 5 mice). h, Mechanical thresholds correlate with dendritic spine remodeling in S1 (shading, 95% CI). Mean ± SEM. *P < 0.05, **P < 0.01, ***P < 0.001, ****P < 0.0001; NS, not significant; by two-sided two-way (b, c, e) or one-way (g) ANOVA followed by Bonferroni’s test. Detailed statistics in Supplementary Table 1.
