. 2023 Mar 13;131(3):031304. doi: 10.1289/EHP12630

Figure 1.

Figure 1 is a pie chart displays the following information: Pesticides are 9 percent, Food additives, indirect additives and contact substances are 38 percent, household fragrance and personal care are 21 percent, and industrial uses are 31 percent. The following information is given: Pesticides: Metabolic are 32 percent, thyroid hormone are 31 percent, estrogen are 25 percent, androgen are 12 percent. Food additives, indirect additives and contact substances: Metabolic are 51 percent, Androgen are 31 percent, Thyroid hormone are 13 percent, and Estrogen are 5 percent. Household fragrance and personal care: Estrogen are 33 percent, Androgen are 25 percent, Thyroid hormone are 28 percent, and Metabolic are 14 percent. Industrial uses: Androgen are 45 percent, Metabolic are 36 percent, Estrogen are 16 percent, and Thyroid hormone are 3 percent.

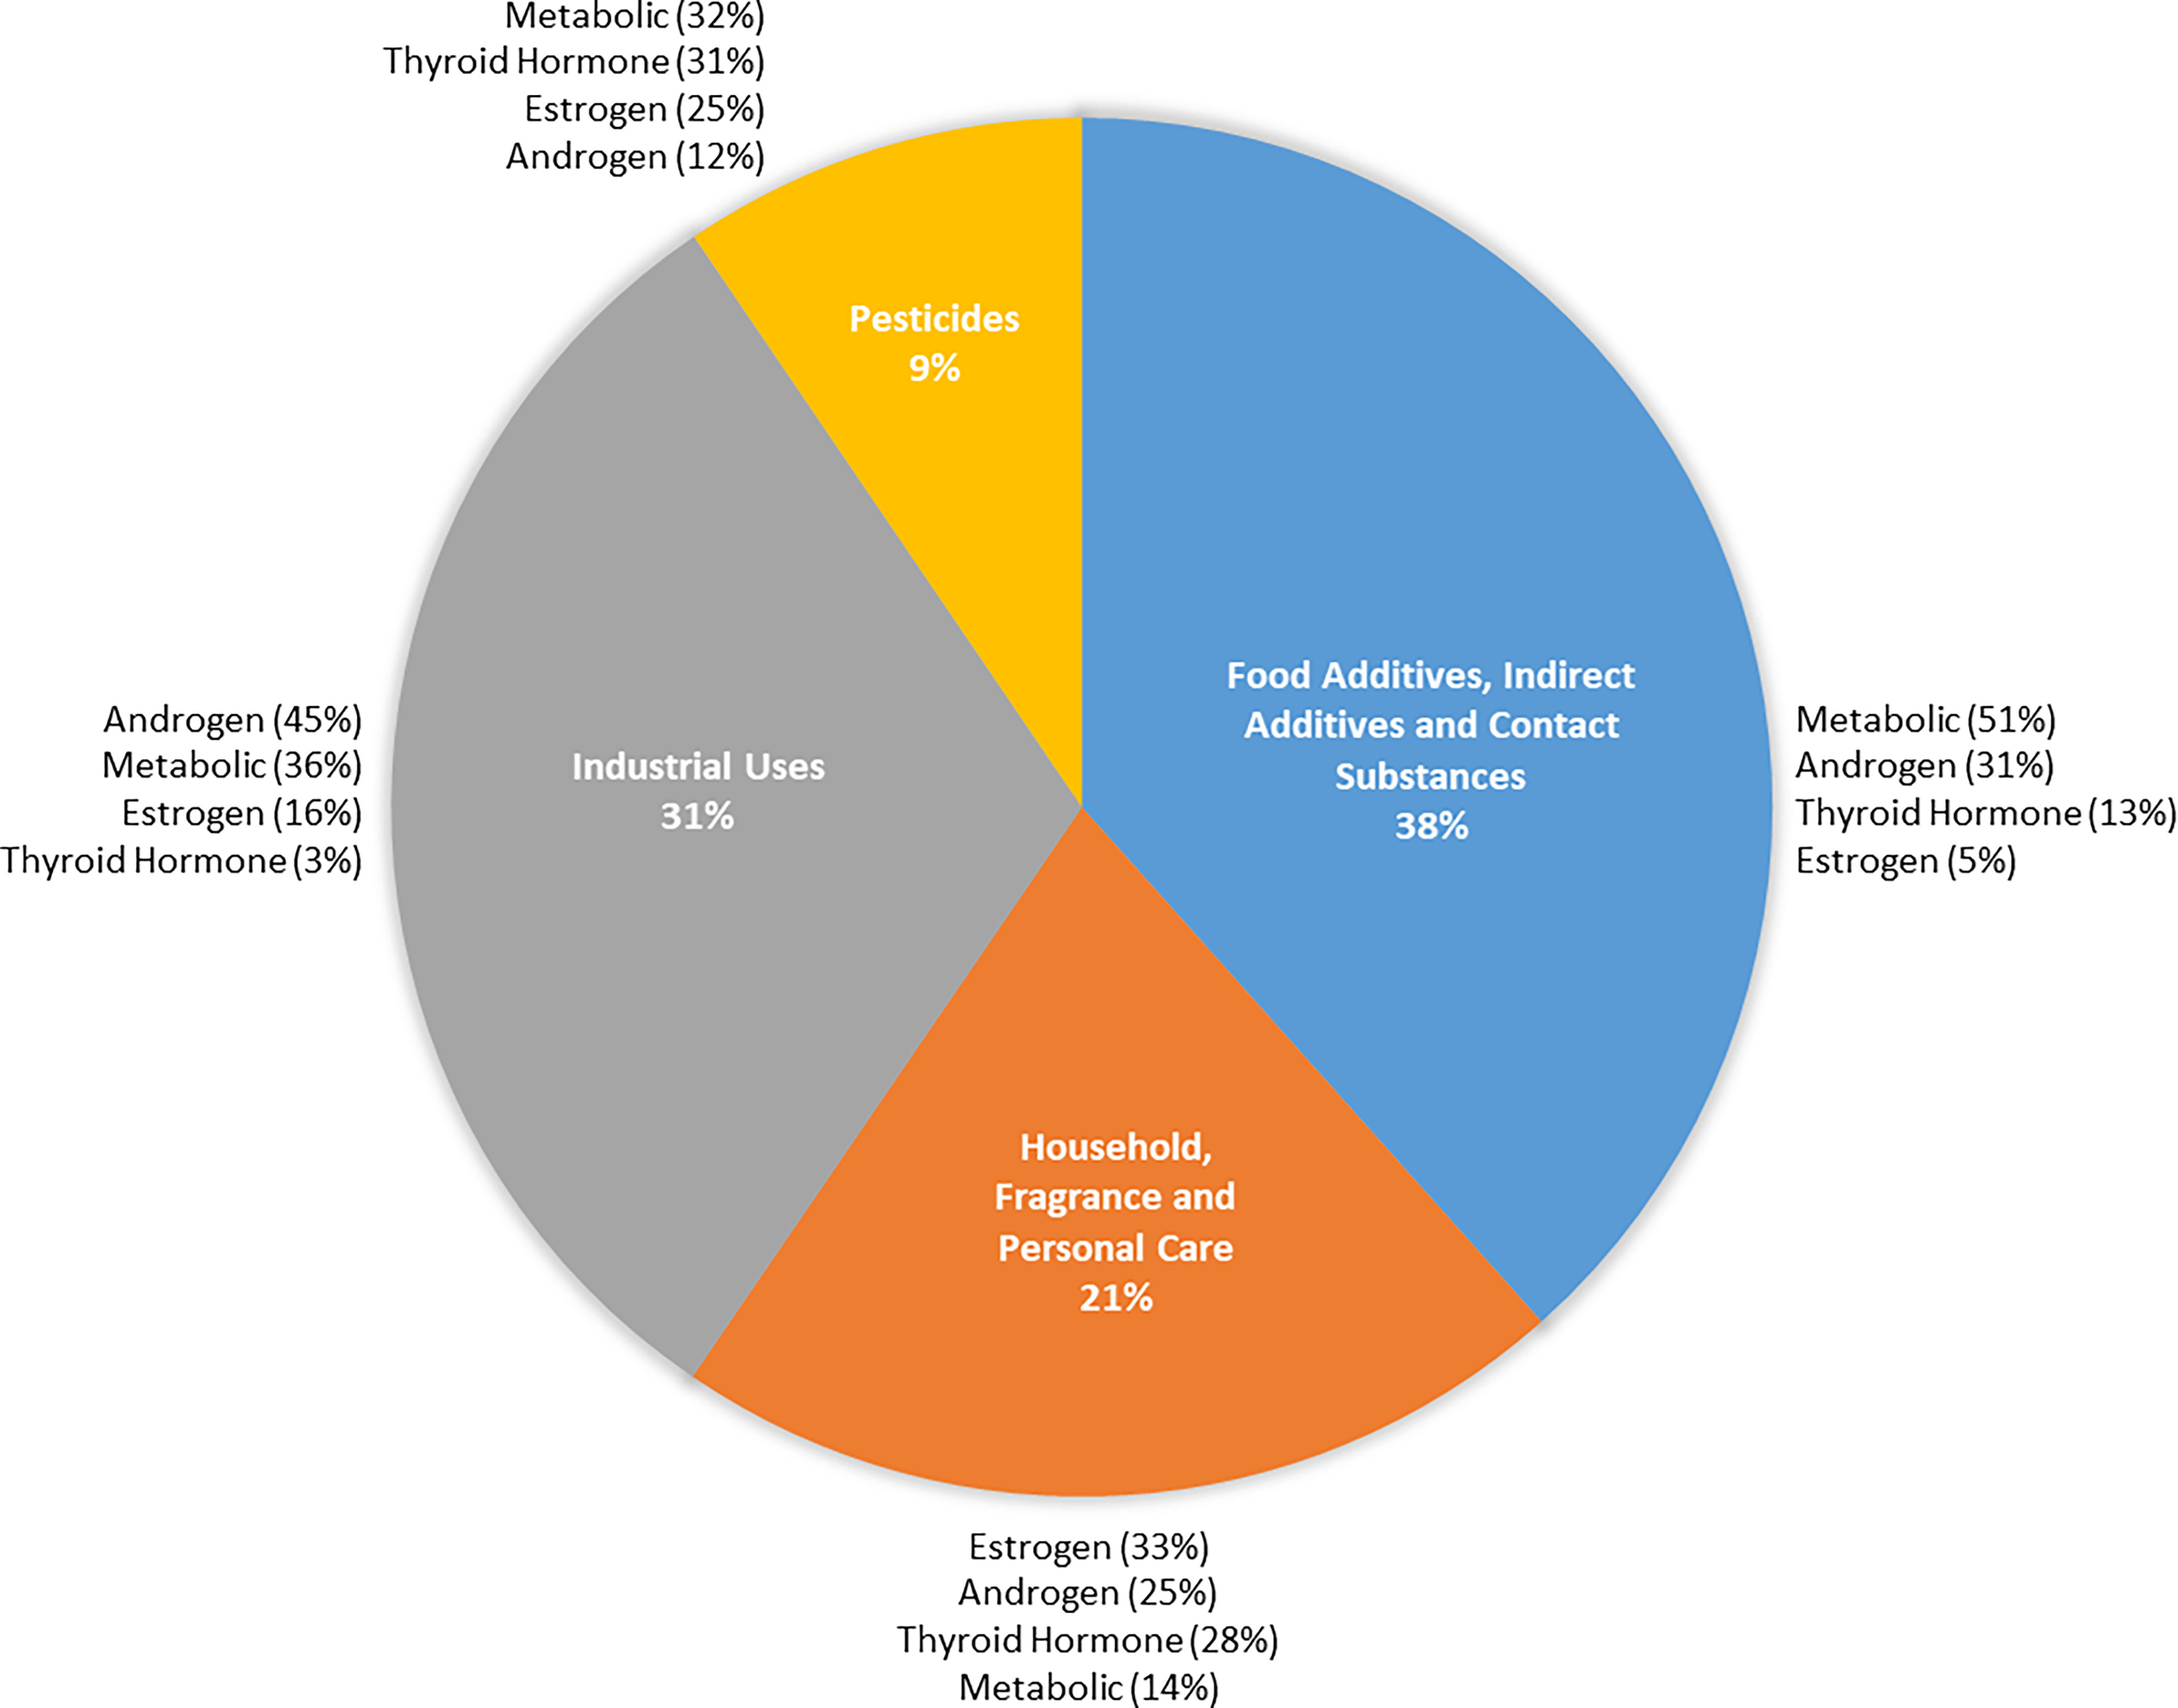
Proportional summed toxic equivalencies by application category and within each category by ToxCast end point (n=145). Application categories derived by summing bioanalytic equivalencies (BEQ%1+ BEQ%2) for chemicals within each category in Zhao et al., Excel Table S8.1