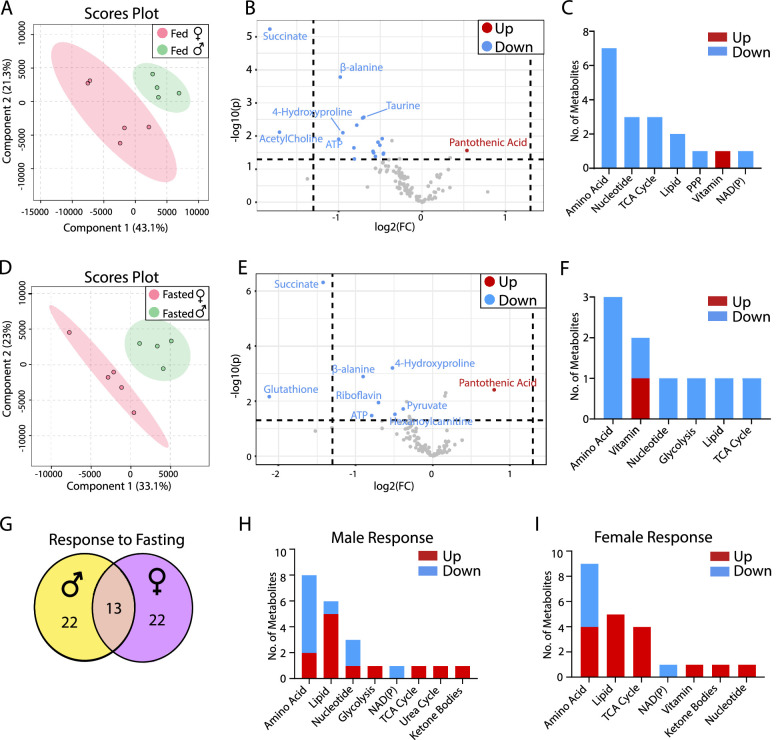
Figure 2.
Sex difference in RPE metabolites in fed and fasted states. (A) PLSDA plots of mouse RPE metabolites from the fed state. (B) Volcano plot of RPE metabolites in the fed state. N = 5. (C) The number of changed metabolites in metabolic pathways in the fed state. (D) PLSDA plots of mouse retinal metabolites from the fasted state. (E) Volcano plot of retinal metabolites in the fasted state. N = 5. (F) The number of changed metabolites from the Volcano plot in metabolic pathways in the fasted state. (G) The number of common and sex-specific changes in RPE metabolites in response to fasting in fasted vs. fed in males or females respectively. (H) The number of changed RPE metabolites in male mice in response to fasting (I) The number of changed RPE metabolites in female mice in response to fasting. FC, fold change.

