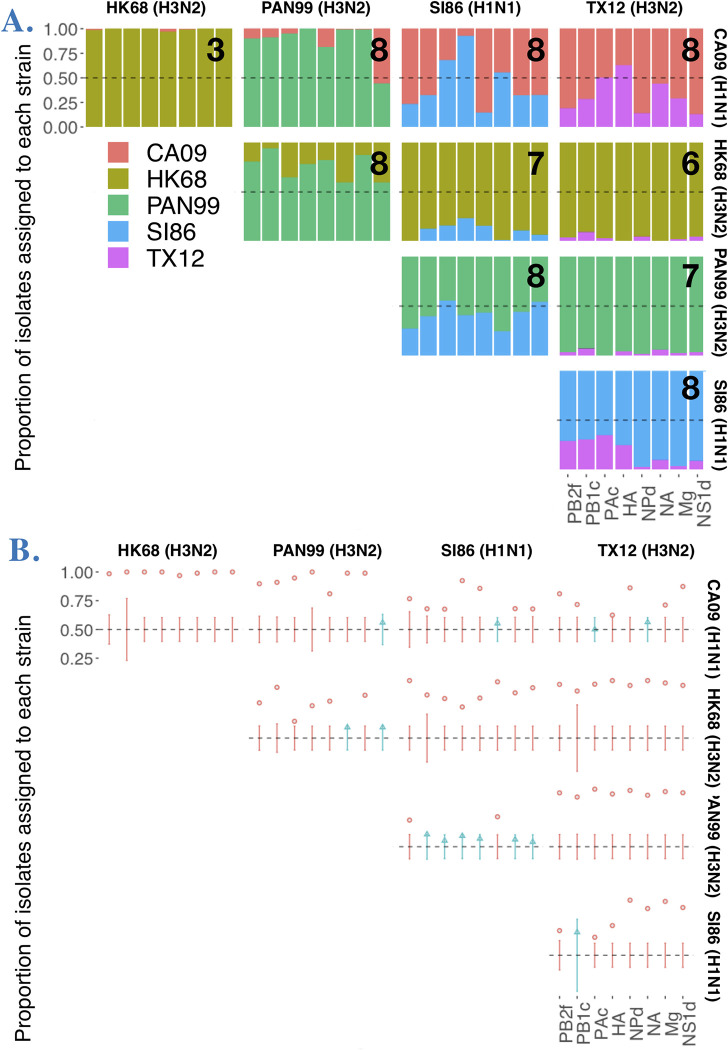
Fig 7. Many segments participate in genetic exchange and are non-randomly distributed in progeny plaque isolates with regard to strain.
A. Plot shows frequency of each strain’s allele for each segment in plaque isolates. The number on the top right corner of each plot indicates the number of segments that participated in reassortment. B. Depicts which segment frequencies are within (blue points) or outside (red points) the confidence interval for 50:50 distribution of strain alleles among plaque isolates.

