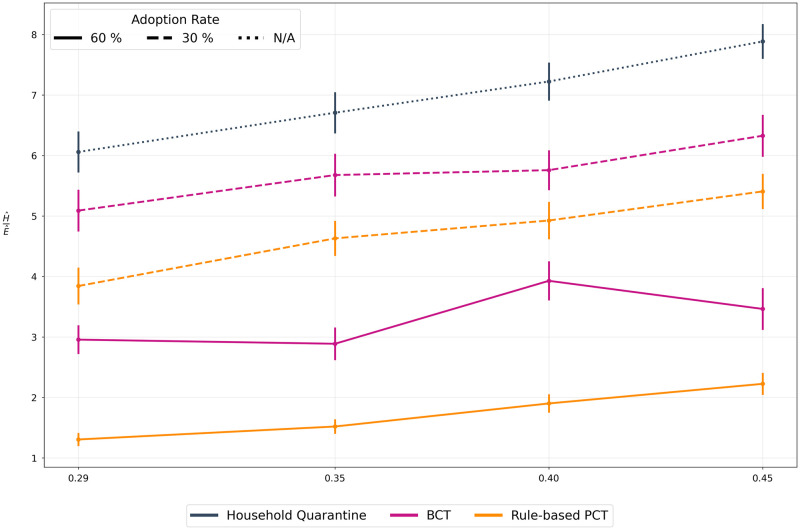
Fig 6. Asymptomatic infection ratio.
We vary the relative infectiousness of asymptomatic cases. A value of f implies that the asymptomatic case can potentially infect f times as many people as compared to a symptomatic case. A value of 0.29 is the chosen minimum as described in the epidemiological literature while a higher value of 0.45 is a hypothetical situation describing a more infectious variant of the virus. Once again, we use N/A to represent irrelevance of adoption rate in the baseline scenario as no DCT app is deployed. Gist As the infectiousness of asymptomatic cases increases, their timely and accurate detection becomes increasingly important. Thus, all the scenarios show a degradation in performance. However, owing to the early warning signals of PCT, it retains its advantage across the range of infection ratios.

