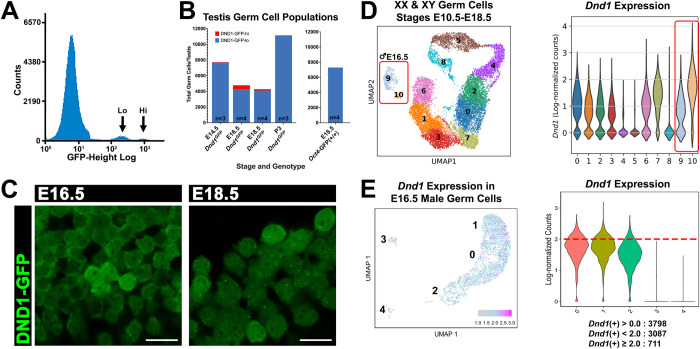
Fig 1. Fetal male germ cells express low or high levels of DND1-GFP and Dnd1.
A: FACS histogram showing one DND1-GFP-negative, and two DND1-GFP-positive populations, representing DND1-GFP-lo and DND1-GFP-hi cells at E18.5. B: FACS quantification for the number of DND1-GFP-lo and DND1-GFP-hi germ cells from E14.5, E16.5, E18.5, P3 DND1-GFP testes (n = 3,4,4,3 respectively). FACS analysis of germ cells from E18.5 Oct4-GFP testes (n = 4) did not show GFP low and high subpopulations. C: Whole mount confocal imaging of unstained freshly dissected E16.5 and E18.5 DND1-GFP testes showing heterogenous endogenous DND1-GFP fluorescence. Scale bar = 20 μm. D: scRNA-seq UMAP for XX and XY germ cell populations from E9.0-E16.5 [32] and violin plot showing DND1 expression levels in clusters 0–10. Red box surrounds E16.5 male germ cell populations represented by clusters 9 and 10. Corresponding violin plots show that clusters 9 and 10 contain cells expressing low and high levels of Dnd1 respectively. E: re-analysis of E16.5 male germ cell scRNA-seq from [31]. UMAP colored to show low to high levels of Dnd1 expression (grey to blue to pink). Violin plot showing levels of Dnd1 expression in clusters 0, 1, 2, 3, and 4, with a level of 2.0 denoted by red broken line. Quantification of total number of Dnd1-expressing cells with expression ≥2.0 = 711 (of 3798 total DND1+ cells).

