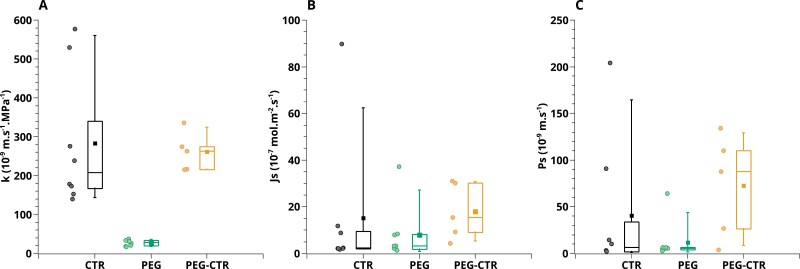
Fig. 8.
Values of radial hydraulic conductivity (A), active solute uptake rate (B), and solute permeability (C) determined by inverse modeling in the indicated root types. Each box indicates the 25th and 75th percentiles, while the line inside indicates the median value, and the T bars mark the fifth and 95th percentiles. Corresponding individual values are shown with the same color on the left of each box plot.

