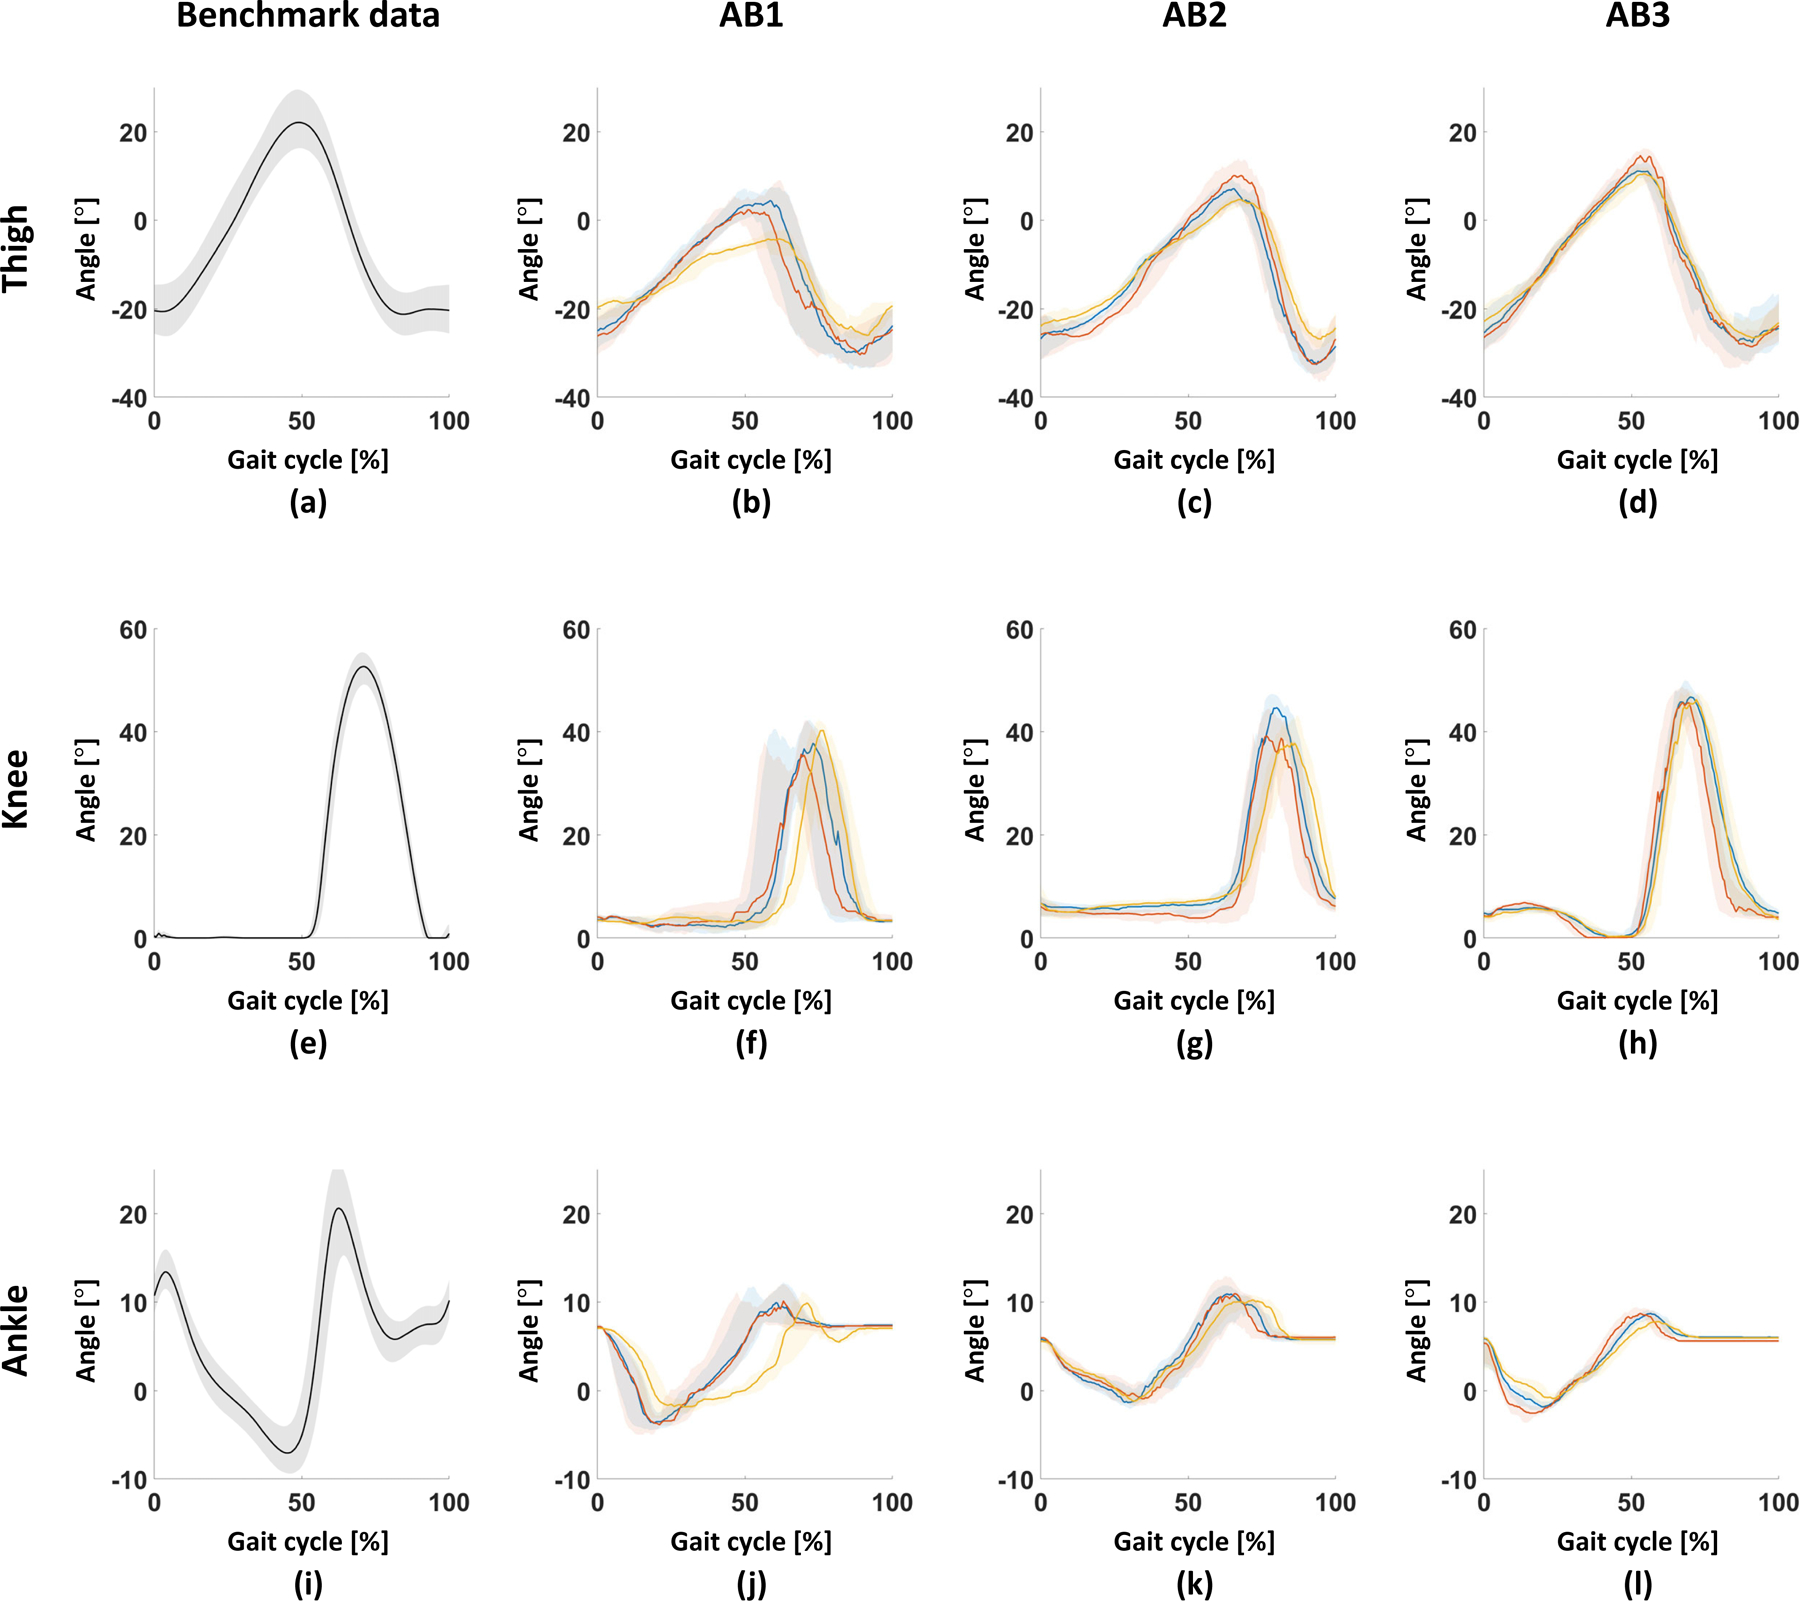
Fig. 6.

Joint trajectories in the gait cycle. From top to bottom, thigh, knee, ankle angles. From left to right, benchmark data, AB1, AB2, AB3. Knee and ankle angles of benchmark data ((e) and (i)) represent equilibrium angles. Blue, red, and yellow lines in bypass data (from the second column to the fourth column) represent trajectories at self-selected, long-, and short-steps, respectively. All plots show 75th and 25th percentiles in lighter bands.
