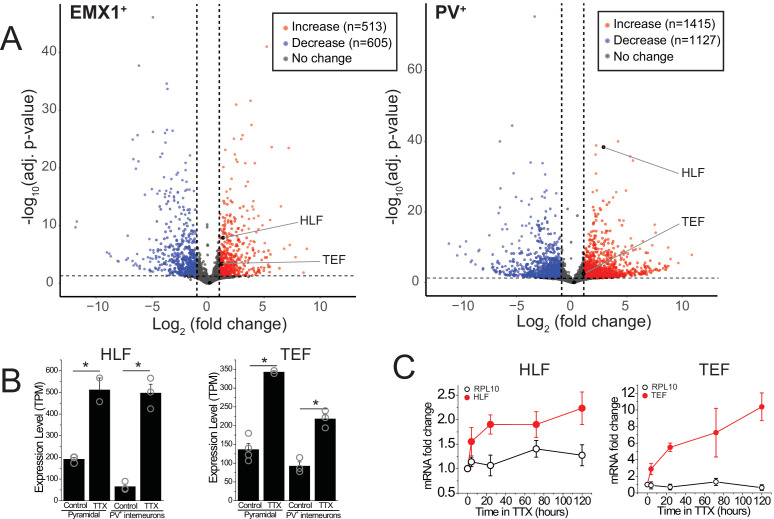
Figure 1. RNA-sequencing identifies transcripts affected by activity deprivation including the PARbZIP family of transcription factors.
(A) Volcano plots of bulk RNA-seq from sorted fluorescently labeled pyramidal cells (left) and PV+ interneurons (right). Dashed lines indicate a fold change of 2 and adjusted p value of 0.05. Differential expression analysis revealed that TTX resulted in upregulation (513 in pyramidal, 1415 in PV+ interneurons) as well as downregulation (605 in pyramidal, 1127 in PV+ interneurons) of genes, among which Hlf and Tef were identified as upregulated with activity block in both excitatory and inhibitory neurons. Statistical analysis (Wald test followed by Benjamini-Hochberg correction) reveals that Hlf and Tef are significantly upregulated in both pyramidal cells and PV+ interneurons, while Dbp and Nfil3 are not significantly altered in either cell type. (B) Bar graphs displaying transcript per million (TPM) values of Hlf (left panel) and Tef (right panel) in pyramidal cells (left) and interneurons (right) in control and 5-day TTX treated slices. Bars are mean values +/- SEM, open symbols are individual experiments. (C). Quantitative real-time PCR analysis of Hlf and Tef expression in whole cortex lysates following a time course of activity deprivation (n = 3–4 slices per time point; error bars are SEM). Two-way ANOVA reveals significant differences between Hlf/Tef and RPL10 (p<0.05).

