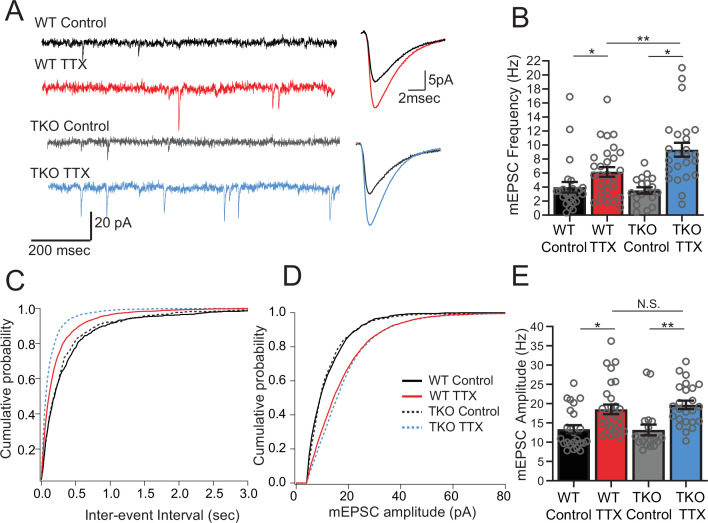
Figure 3. Frequency but not amplitude of excitatory synaptic currents is disproportionally upregulated in TTX-treated TKO slices.
(A) Representative traces of mEPSC recordings from WT control (black), WT TTX-treated (red), TKO control (gray), and TKO TTX-treated (blue) slices. Right panel, average mEPSC waveforms for the same conditions. Both the frequency and the amplitude is increased in TTX-treated slices; however, the increase in frequency is more dramatic in TKO slices. (B) Quantification of mEPSC frequency for each condition. Colored bars with error bars are mean ± SEM, open circles are individual cells; N = 24 for WT control, N = 29 for WT TTX, N = 18 for TKO control, and N = 24 for TKO TTX. Two-way ANOVA revealed significant main effect of TTX treatment (p < 0.0001), genotype alone (p=0.030) and interaction between treatment and genotype (p = 0.041). Post hoc Tukey test revealed enhanced effect of TTX on mEPSC frequency in TKO cells compared to WT (p = 0.009, **). (C) Cumulative probability histogram for mEPSC inter-event intervals in each condition. (D) Cumulative probability histogram for mEPSC amplitudes in each condition. (E) mEPSC amplitudes for each condition. Two-way ANOVA revealed significant main effect for drug treatment (p < 0.0001) but not genotype (p = 0.74) or interaction between treatment and genotype (p = 0.55). TTX treatment enhanced mEPSC amplitude in both WT (p = 0.012, Tukey post hoc test, *) and TKO (p = 0.0035, Tukey post hoc test, **) to the same extent (p = 0.89, WT TTX compared to TKO TTX, Tukey post hoc test, N.S.). TKO, triple knockout; WT, wild-type.

