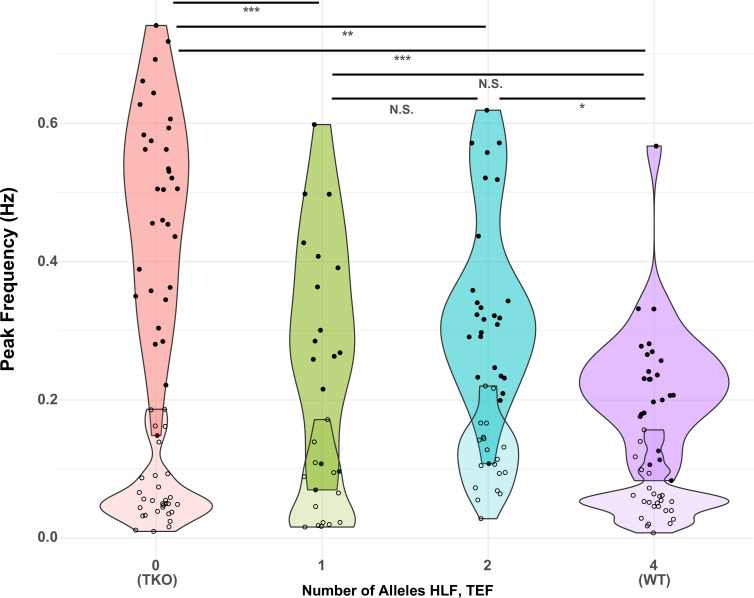
Figure 6. Presence of one allele of Hlf or Tef largely restores the WT response to activity deprivation.
Violin plots show the distribution of peak frequencies measured from TTX-treated (upper, darker colors, filled symbols) and control (lower, lighter colors, open symbols) slice cultures made from animals carrying 0, 1, 2, or 4 alleles of the PARbZIP TFs Hlf and Tef. Data are those used in Table 1 with the X-axis corresponding to models 6 (TTX) and 12 (Control). Horizontal positions of individual data points are jittered to prevent overplotting. Horizontal lines at top indicate results of post hoc t tests between levels for the TTX data with Tukey correction for multiple comparisons. *adj. p < 0.05, **adj. p < 0.01, ***adj. p < 0.001, N.S. – not significant, adj. p > 0.05. No post hoc testing was performed for the Control data since the fit of model 12 was not significant. WT, wild-type.

