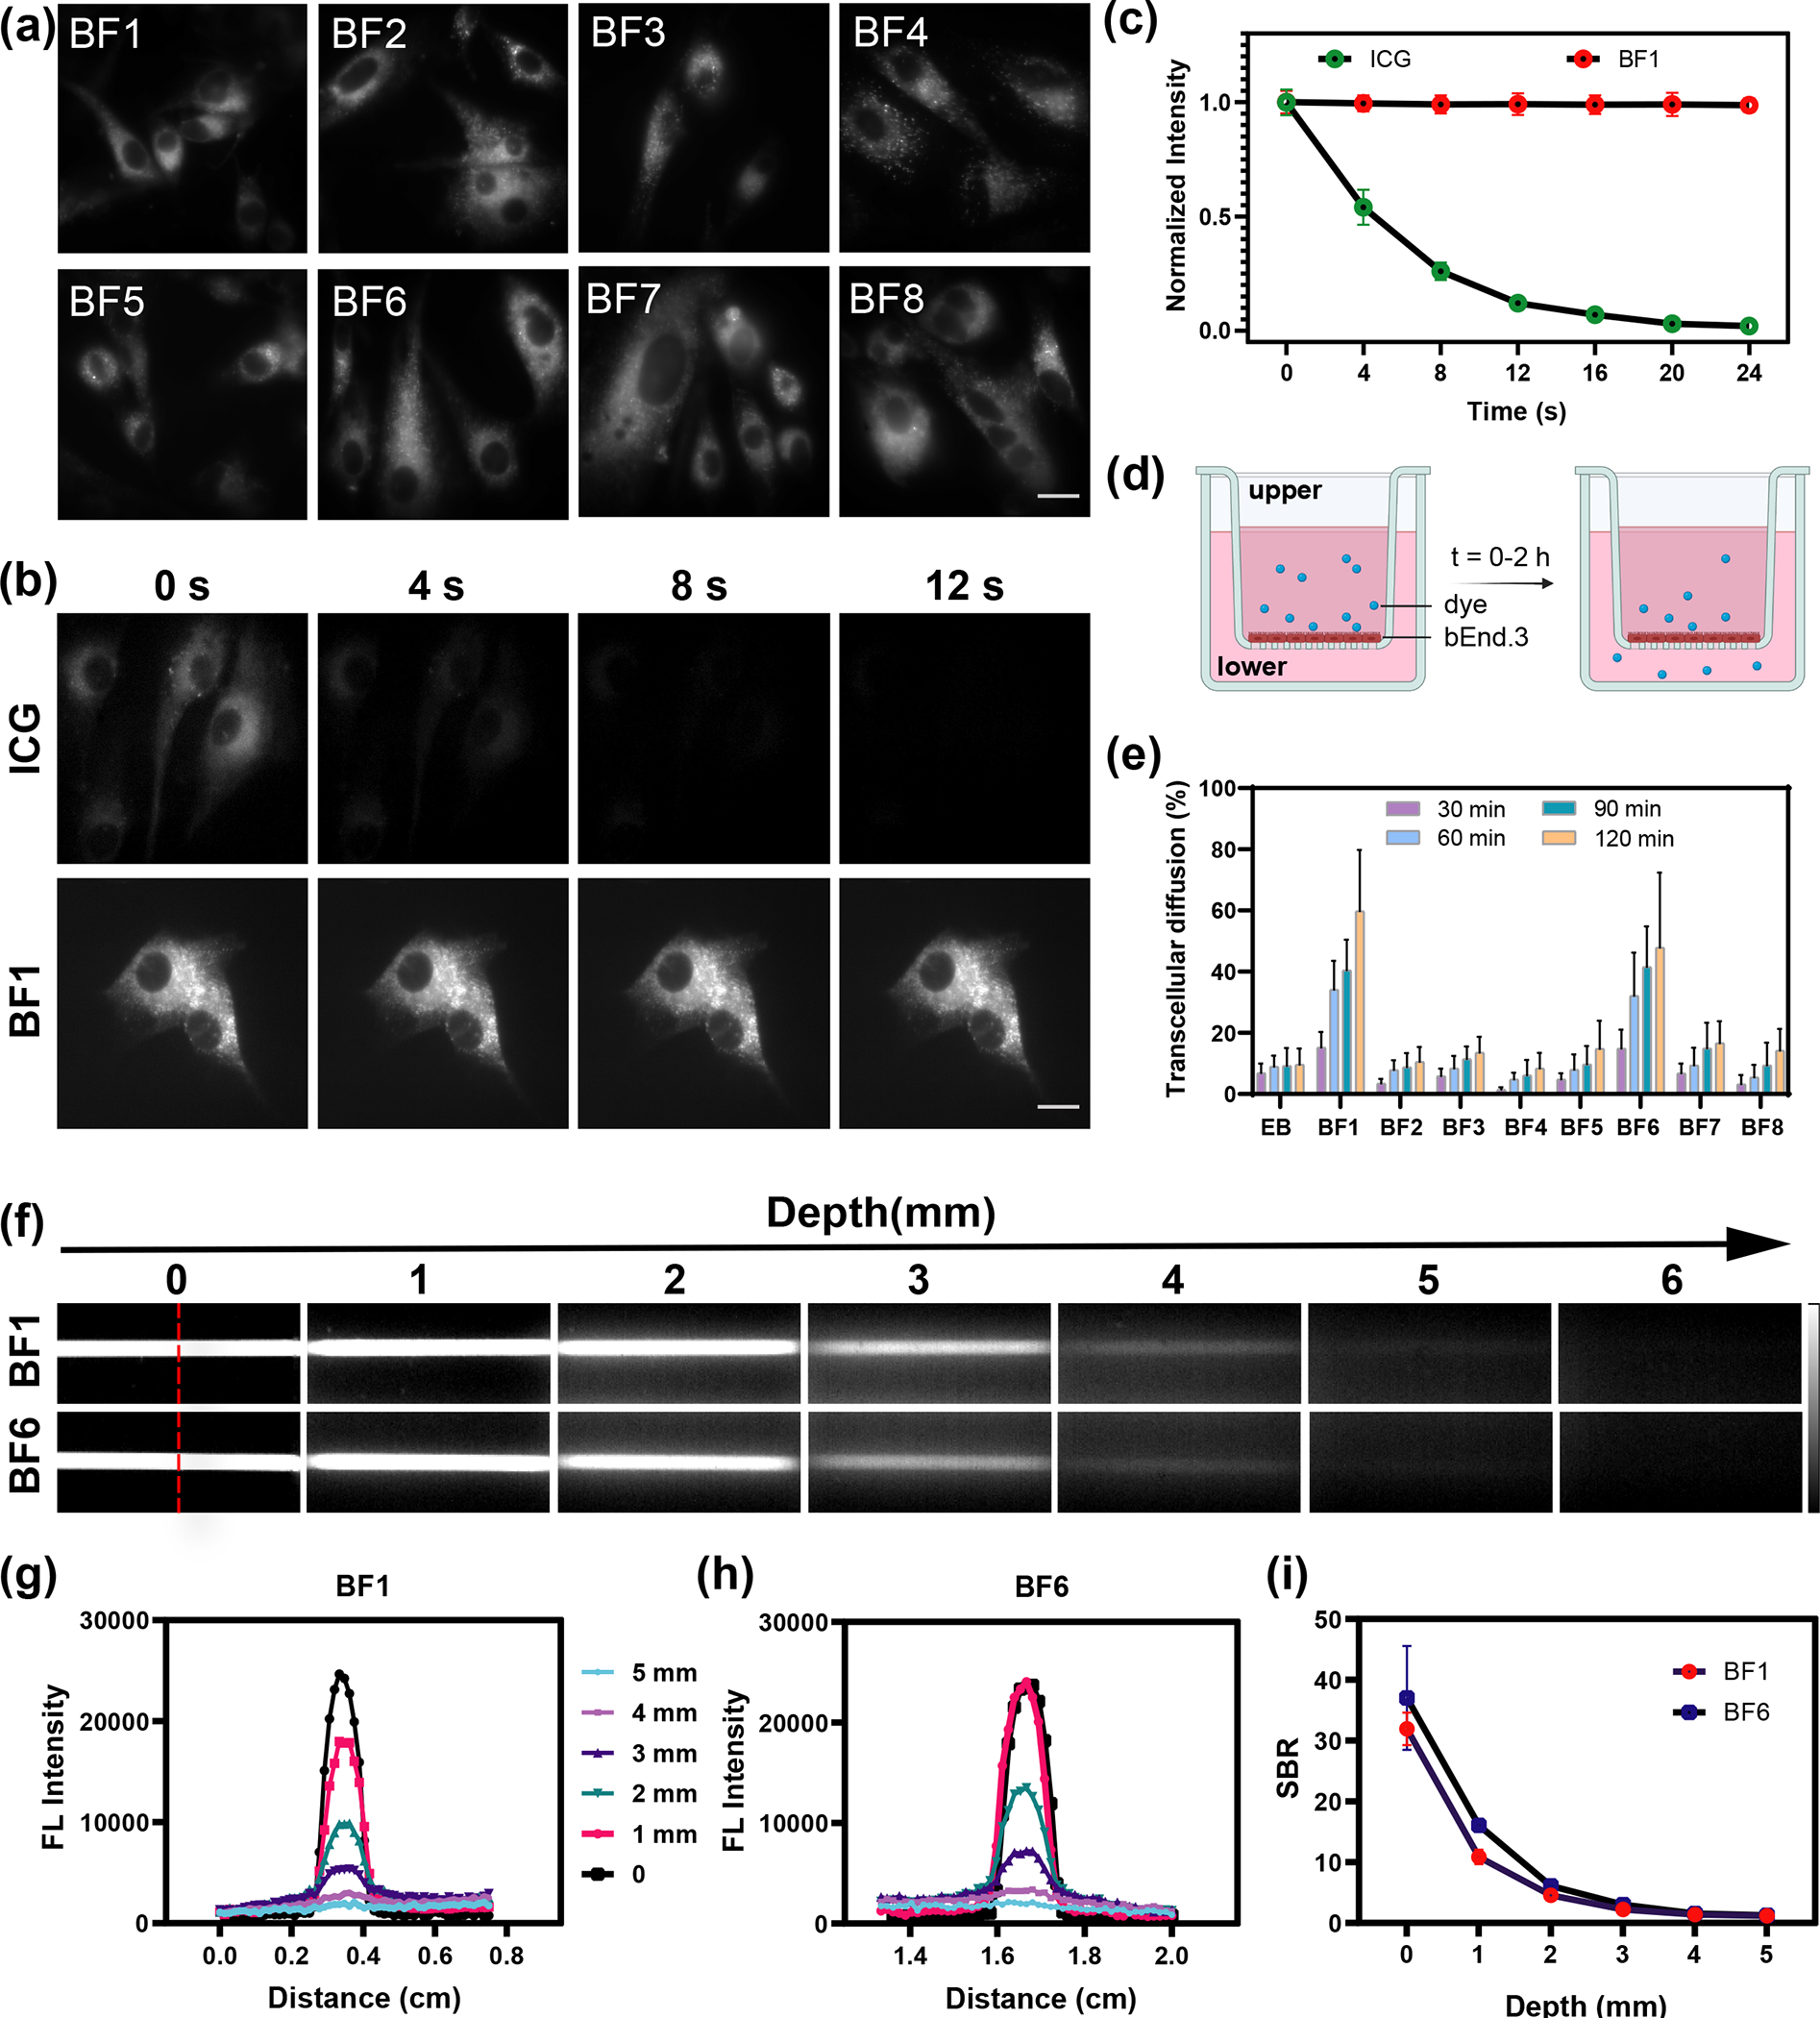
Figure 2.

(a) Fluorescence imaging of BF1- BF8 in U-87 MG cells. All cell imaging experiments were performed using an NIR-II microscope with a 663 nm excitation laser (200 W cm−2, exposure 10 ms) and 950 ± 50 nm emission filter. Scale bar is 10 μm. (b) Fluorescence imaging of ICG and BF1 in U-87 MG cells at 0, 4, 8, 12 s under laser irradiation. Scale bar is 10 μm. (c) Cellular photostability curves of ICG and BF1 within 25 seconds. (d) Schematic diagram of in vitro BBB model used in this study. (e) The relative transcellular diffusion amount of BF1-BF8 and EB in vitro within 2 hours. (f) Fluorescence images (excitation 808 nm, LP 1000 nm) of the capillary tube filled with BF1 and BF6 at depths of 0–6 mm in 1% Intralipid mimic tissue. (g, h) The cross-sectional fluorescence intensity profiles of BF1 and BF6 along the red dash line in (f) at different tissue depths. (i) The signal-background ratio (SBR) curves of BF1 and BF6 in 1% Intralipid®.
