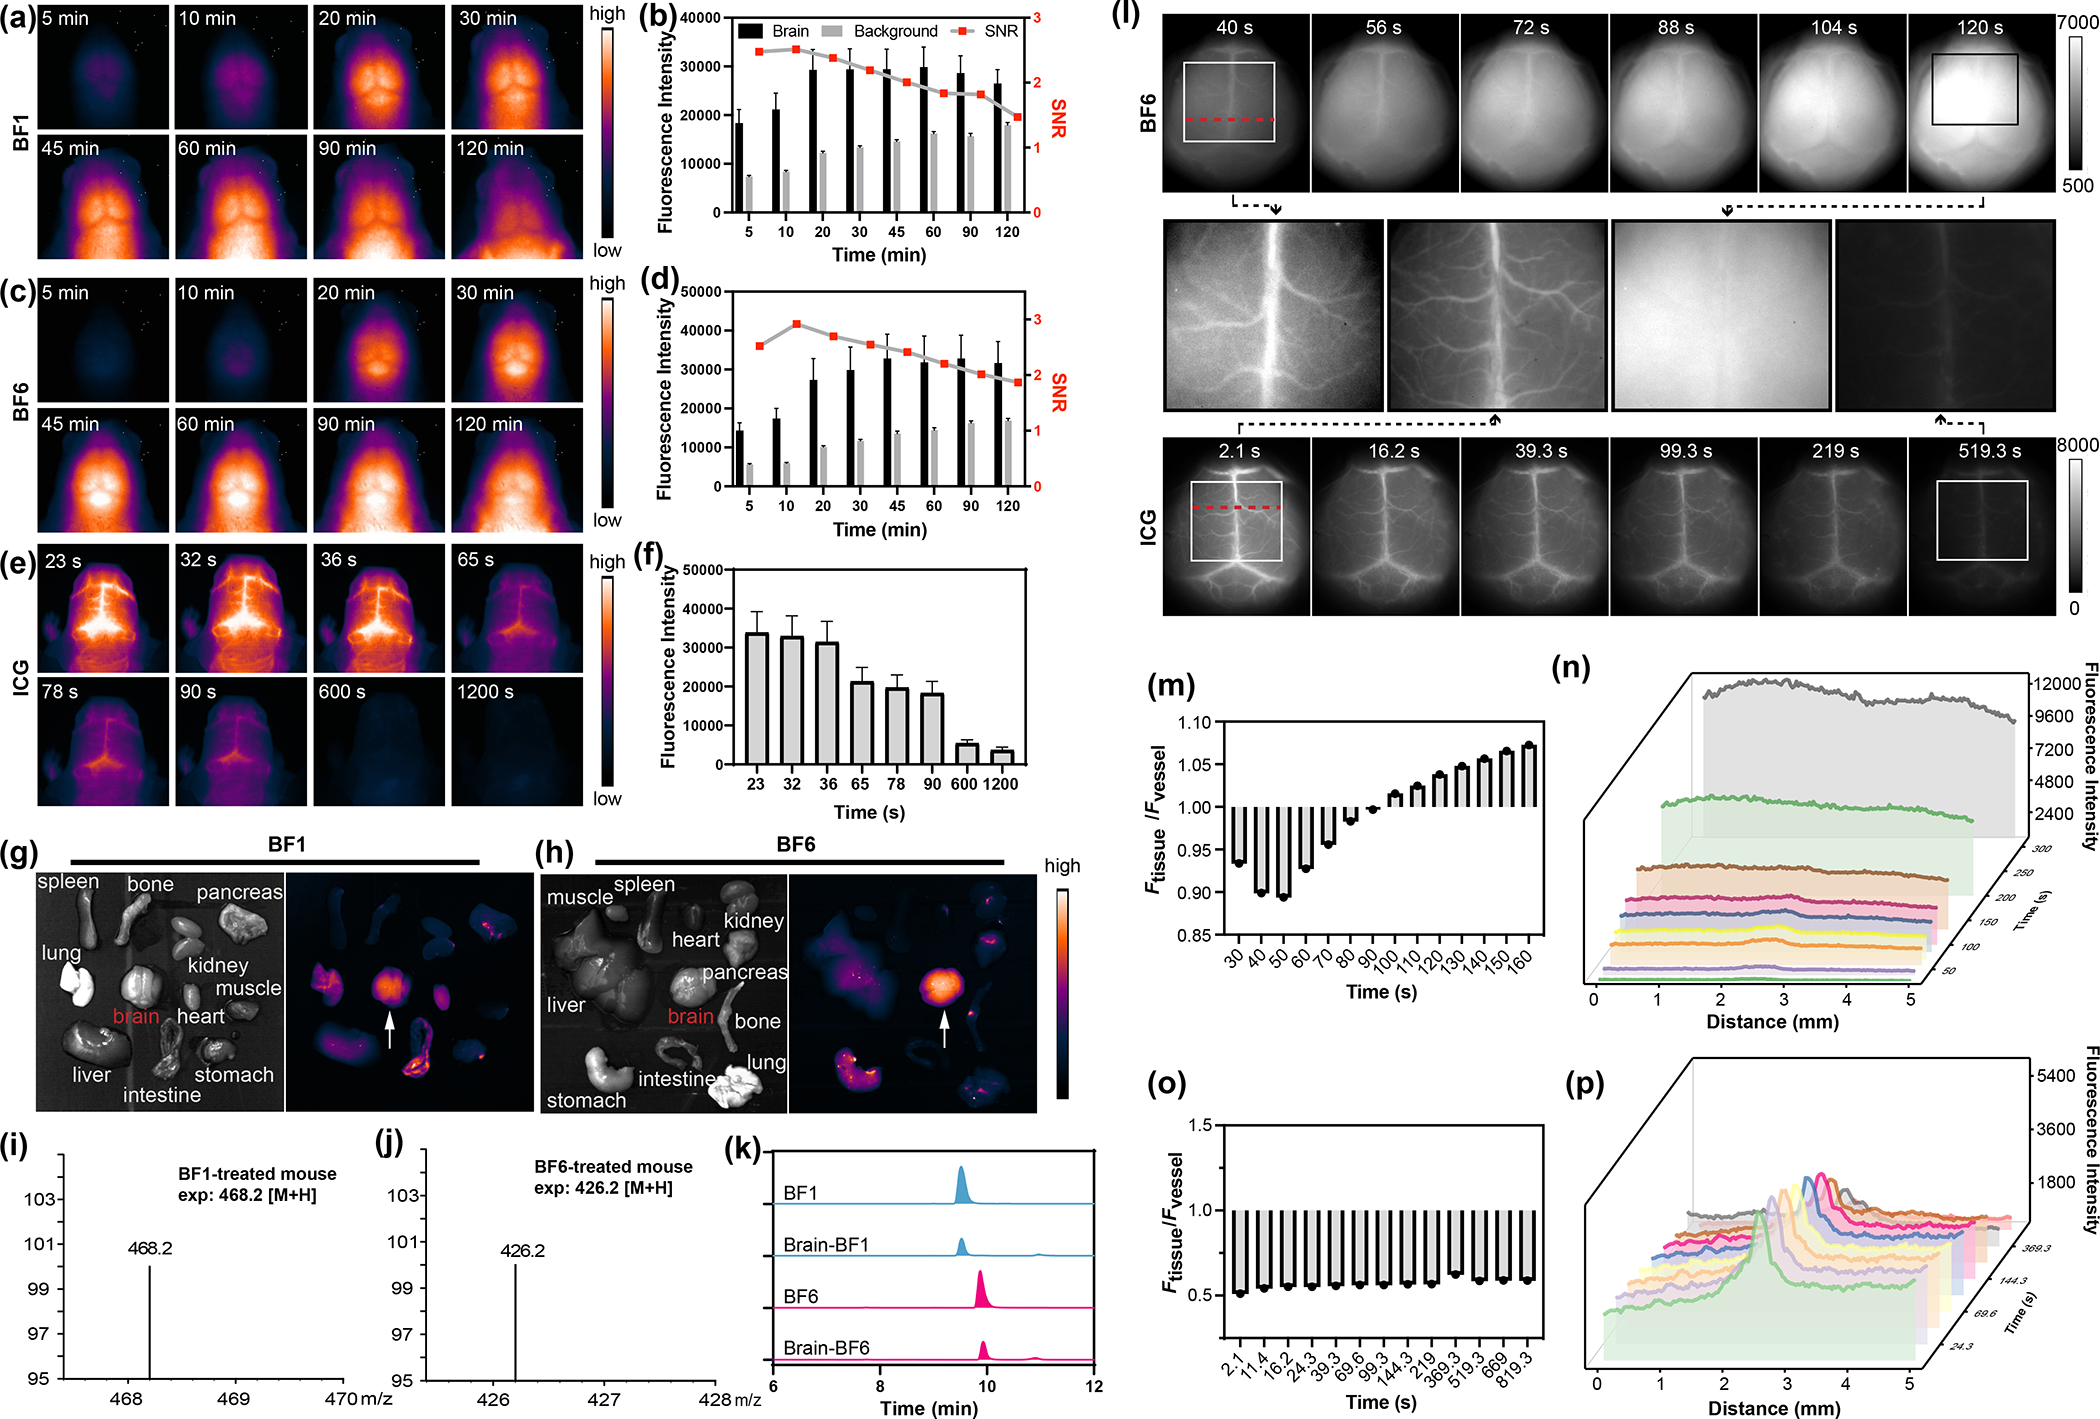
Figure 3.

(a) In vivo NIR-II fluorescence imaging of cerebral tissue of mice injected with BF1 (200 μL, 200 μM, tail vein injection) at time intervals from 5 to 120 min. (70 mW cm−2, 808 nm laser, 1000 nm LP filter). (b) Time-dependent signal-to-noise ratio (SNR) changes determined by the NIR-II fluorescence imaging of BF1-treated mice. (c) In vivo NIR-II fluorescence imaging of cerebral tissue of mice injected with BF6 as described in (a). (d) SNR changes of BF6-treated mice. (e) In vivo NIR-II fluorescence imaging of cerebral tissue from nude mice injected with ICG (200 μL, 200 μM) at certain time intervals from 5 s to 1200 s. (f) The fluorescence intensity changes of the brain at designated time points. (g, h) The fluorescence images of the heart, lung, kidney, spleen, liver, brain, intestine, stomach, bone, muscle, and pancreas at 2 hour after the injection of BF1 and BF6. (i, j) Mass spectra from extracted brain tissue of mice after intravenous injection of BF1 and BF6 for 1 hour. (k) HPLC spectra of BF1, BF6 standards and responding brain homogenate of mice treated with BF1 and BF6. (l) In vivo NIR-II fluorescence imaging change of brain vessels and tissue at different time points after intravenous injection of BF6 and ICG. (m) Fluorescence ratio changes of brain tissue and vessel after intravenous injection of BF6 in (l) at different time points. (n) Cross sectional fluorescence intensity profile along the red dash line in (l) collected by a 1000 nm long-pass filter at designated time points after intravenous injection of BF6. (o) Fluorescence ratio changes of brain tissue and vessel after intravenous injection of ICG in (l) at different time points. (p) Cross sectional fluorescence intensity profile along the red line in (l) collected by a 1000 nm long-pass filter at designated time points after intravenous injection of ICG.
