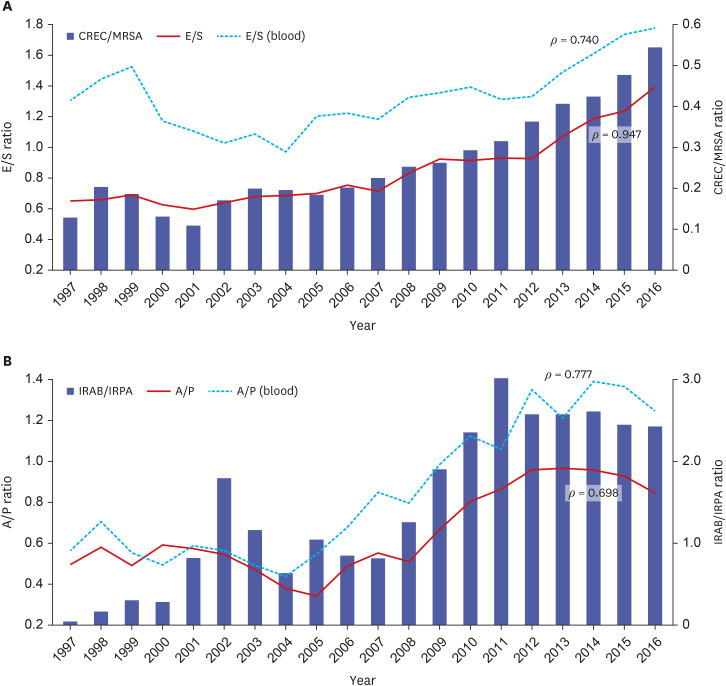
Fig. 2. Correlation between species distribution and antimicrobial resistance of four most prevalent species. (A) Correlation analysis of the E/S ratio and the CREC/MRSA ratio showed strong correlation in total isolates (ρ = 0.947) and moderate correlation with blood isolates (ρ = 0.740). (B) The A/P ratio and the IRAB/IRPA ratio showed moderate correlations in both total (ρ = 0.698) and blood isolates (ρ = 0.777).
E/S ratio = ratio of the number of isolates of Escherichia coli to those of Staphylococcus aureus, CREC/MRSA ratio = ratio of % cefotaxime-resistant E. coli to % oxacillin-resistant S. aureus, A/P ratio = ratio of the number of isolates of Acinetobacter baumannii to those of Pseudomonas aeruginosa, IRAB/IRPA ratio = ratio of % imipenem-resistant A. baumannii to % imipenem-resistant P. aeruginosa.

