

Abstract
Correlations in observational studies are commonly misinterpreted as causation. Although correlation is necessary to establish a causal relationship between two variables, correlations may also arise due to chance, reverse causality, or confounding. There are several methods available to orthopaedic researchers to determine whether the observed correlations are causal. These methods depend on the key components of the study including, but not limited to, study design and data availability on confounders. In this paper, we illustrate the main concepts surrounding correlation and causation using intuitive real-world examples from the orthopaedic literature. Please visit the following https://www.youtube.com/watch? v¼WW7pFudZbHA&t¼52s for a video that explains the highlights of the paper in practical terms.
Keywords: correlation, causation, confounding, chance, orthopaedics, arthroplasty
Graphical Abstract
Introduction
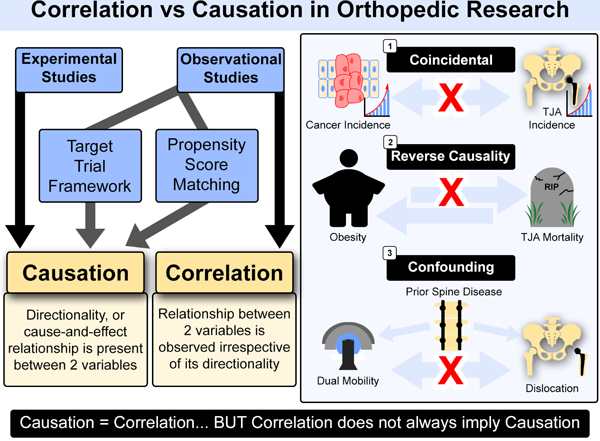
Orthopaedic research studies typically involve the evaluation of the association between two or more variables. There are two types of association that can be identified: correlational and causal. Correlational associations are common in non-experimental, observational studies where the relationship between two or more variables is observed irrespective of its directionality. Conversely, causal association between variables requires demonstration of the directionality of any proposed cause-and-effect relationship, typically demonstrated in experimental and longitudinal studies. Correlation does not imply causation, whereas, causation frequently occurs with correlation. Correlation and causation are related concepts, but may require different study designs, and statistical approaches to fully establish. The aim of this paper was to provide practical insights on the difference between the two with intuitive examples from the orthopaedic literature. We present practical guidelines on how to distinguish the two using real-world examples.
Correlation Does Not Imply Causation
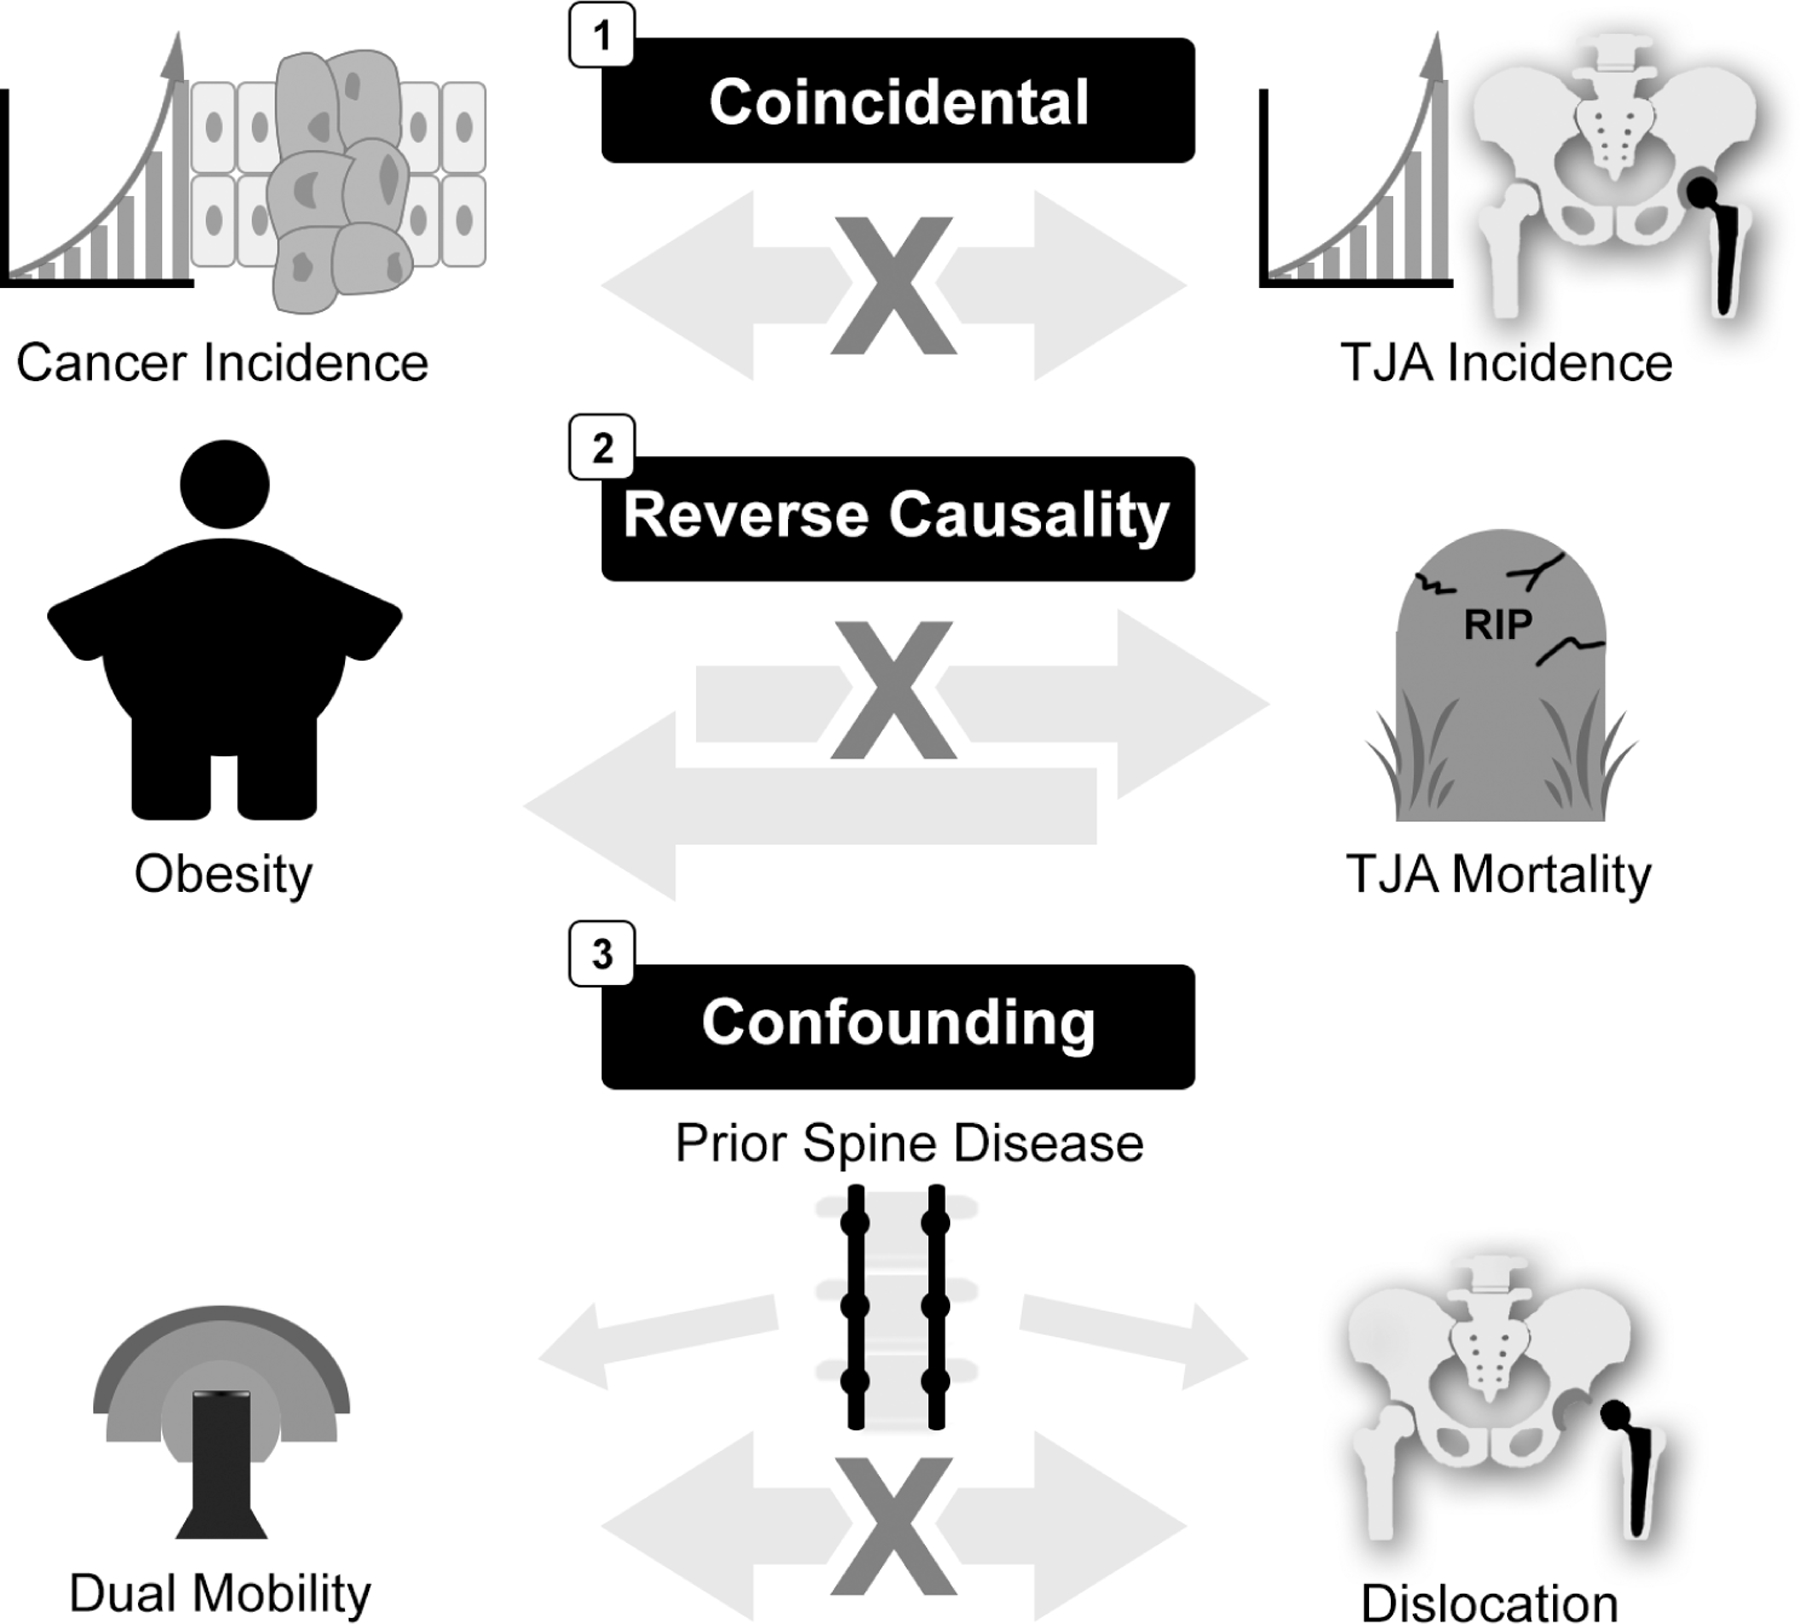
Anyone who has taken a statistics class, may well have heard the phrase: “correlation does not imply causation.” In fact, correlation only implies that an association exists between two variables X and Y. When the two variables are correlated, one may change with the other, but that is all that can be said. Causation, on the other hand, implies that a change in one variable directly causes a change in the other one. Correlation is commonly mistaken for causation [1]. The reasons for this pitfall, and why correlation often does not equal causation, is usually due to one of three different factors (See Figure 1). First, the relationship between two variables can be coincidental, which means it occurs by chance alone. For instance, temporal trends in rising incidence of breast cancer or liver disease may be strongly correlated with a concurrent rising incidence of total joint arthroplasty (TJA), but this is purely coincidental.
Fig. 1.
Role of chance, reverse causality and confounding.
Another issue that can distort the relationship between two variables is reverse causality (See Figure 1). This is the instance where we observe X (cause) causing Y (effect), but in fact it is the outcome that precedes the cause. Reverse causality is particularly a concern in studies with short follow-up. Reverse causality is common in studies of examining lifestyle factors (e.g., body mass index [BMI], bone mineral density, alcohol intake, vitamins, diet) as the exposure [2,3]. For instance, very low BMI is associated with a higher risk of short-term mortality in TJA patients, but this is in part due to reverse causality where low BMI simply reflects underlying poor health status [4]. Another example is alcohol consumption and the risk of perioperative complications and mortality. Alcohol consumption is related to several health problems and poor health. In turn, poor health prior to TJA surgery could lead to cessation of alcohol consumption, introducing reverse causality where abstainers have the highest mortality risk [5]. Finally, consider a hypothetical example where patients undergoing treatment for osteosarcoma who have complete surgical resection of the tumor may not need adjuvant therapy. However, patients who have incomplete resection of the tumor may undergo adjuvant treatment with chemotherapy or radiation and may have higher tumor recurrence rates than those who did not need adjuvant treatment. Therefore, it may appear that receiving adjuvant therapy caused a higher rate of tumor recurrence.
Third. the most common and well-known reason why correlation is mistaken for causation is the presence of confounders [6]. In the presence of measured or unmeasured confounders, the true relationship between X and Y can be so distorted that they may look causally related when in fact they are not (See Figure 1). Consider the case of what might be an expected lower risk of prosthetic hip implant dislocation with dual mobility constructs [7]. In a registry-based study, we may find that dual mobility constructs are not associated with a reduced risk of dislocation, when in reality, an unmeasured confounder such as prior spine disease influences the choice of dual mobility implants as well as the risk of dislocation.
This “selection bias” could result in a lowering of what would have been a much higher dislocation rate in this high-risk patient subset who have spine disease. And if such spine patients are numerous enough, this could result in the overall dislocation rate for dual mobility implants being the same as standard articulations across the entire study population, despite there being a real benefit of dual mobility devices.
Inferring Causality in Observational Studies
The aim of most orthopaedic studies is identification of causal relationships between exposures (i.e., risk factors, protective factors, treatments) and outcomes. Statistically, we can think of the casual inference as the probability of Y given that we “do” X. Doing X means that we apply an intervention or anything that will indeed cause the effect. In causal inference, if X is the cause of the effect Y, then a change in X results in a change in Y, but not vice versa. Three conditions must be met to make a casual inference: (1) the cause precedes the effect in time; (2) the cause and the effect are empirically related; and (3) the relationship between X and Y is not due to a third variable. The study design will determine what approach is suitable to evaluate whether the relationship between two variables is causal or not. In randomized trials, the effect of third variables (i.e., measured and unmeasured confounders) is minimized through randomization, and hence, it is reasonable to assume that the observed change in Y (effect) is attributable to the change in X (cause). Consider the scenario in which patients who have knee osteoarthritis are randomized to total knee arthroplasty (TKA) followed by 12 weeks of nonsurgical treatment or only 12 weeks of nonsurgical treatment and the outcome is change in the Knee and Osteoarthritis Outcome Score (KOOS) from baseline to one year [8]. Since randomization minimizes confounding and the trial includes a nonsurgical treatment as the control group, it is likely that the effect observed in the outcome is, for the most part, due to the surgery.
Inferring causality in observational studies is challenging due to the presence of reverse causality and confounding. The nine Bradford-Hill criteria (strength, consistency, specificity, temporality, biological gradient, plausibility, coherence, experiment, analogy) still remain the cornerstone of causality assessment in observational studies [9]. However, other methods became available in recent years for inferring causality. These include the potential outcome framework and triangulation of evidence [9,10]. For a hypothetical exposure, the potential outcome framework defines the causal effect for a patient as the difference between the outcome observed who does and does not have such exposure. On the other hand, triangulation of evidence is the: “practice of strengthening causal inferences by integrating results from several different approaches, where each approach has different (and assumed to be largely unrelated) key sources of potential bias.’ [11]. While statistical methods such as multivariable regression, propensity scores [12], stratification, and weighting are commonly used to adjust for measured confounding, statistical adjustment cannot account for unmeasured confounders or for reverse causality.
Approaches to Minimize Reverse Causality
Reverse causality arises when the outcome of interest causes the exposure. It can occur in cross-sectional studies or studies with short follow-up where the underlying disease status (typically undiagnosed) negatively impacts the exposure of interest. The observed association between the exposure and outcome is driven by the causal link between the underlying disease status and the outcome, rather than the exposure of interest. This leads to an overestimation of the association between exposure and outcome. In cohort studies, reverse causality can be minimized through longer follow-up, or by removing patients who have prevalent disease at baseline or those who experienced the outcome soon after baseline. For example, in a study examining the association between BMI and mortality in TJA, frail patients who have cancer, heart failure or other major comorbidities, as well as early deaths that occur soon after surgery, are excluded from the analysis. However, this is not always feasible when the follow-up duration is short, and the number of outcome events is low. Reverse causality can also arise in studies examining the cumulative effect of an exposure on time to occurrence of an outcome and it is known that the exposure changes with the onset of the outcome. For example, in a study examining the role of post-TJA physical activity (exposure) on time to revision (outcome), patients who experience pain due to impending implant loosening may reduce their physical activity and therefore, high physical activity may appear protective. In particular, physical activity measures close to revision would result in spurious associations due to reverse causality. Therefore, long follow-up or appropriate exclusion of patients or outcomes are essential to minimize reverse causality. Another approach to address reverse causality is Mendelian randomization, as described below.
Approaches to Minimize Unmeasured Confounding
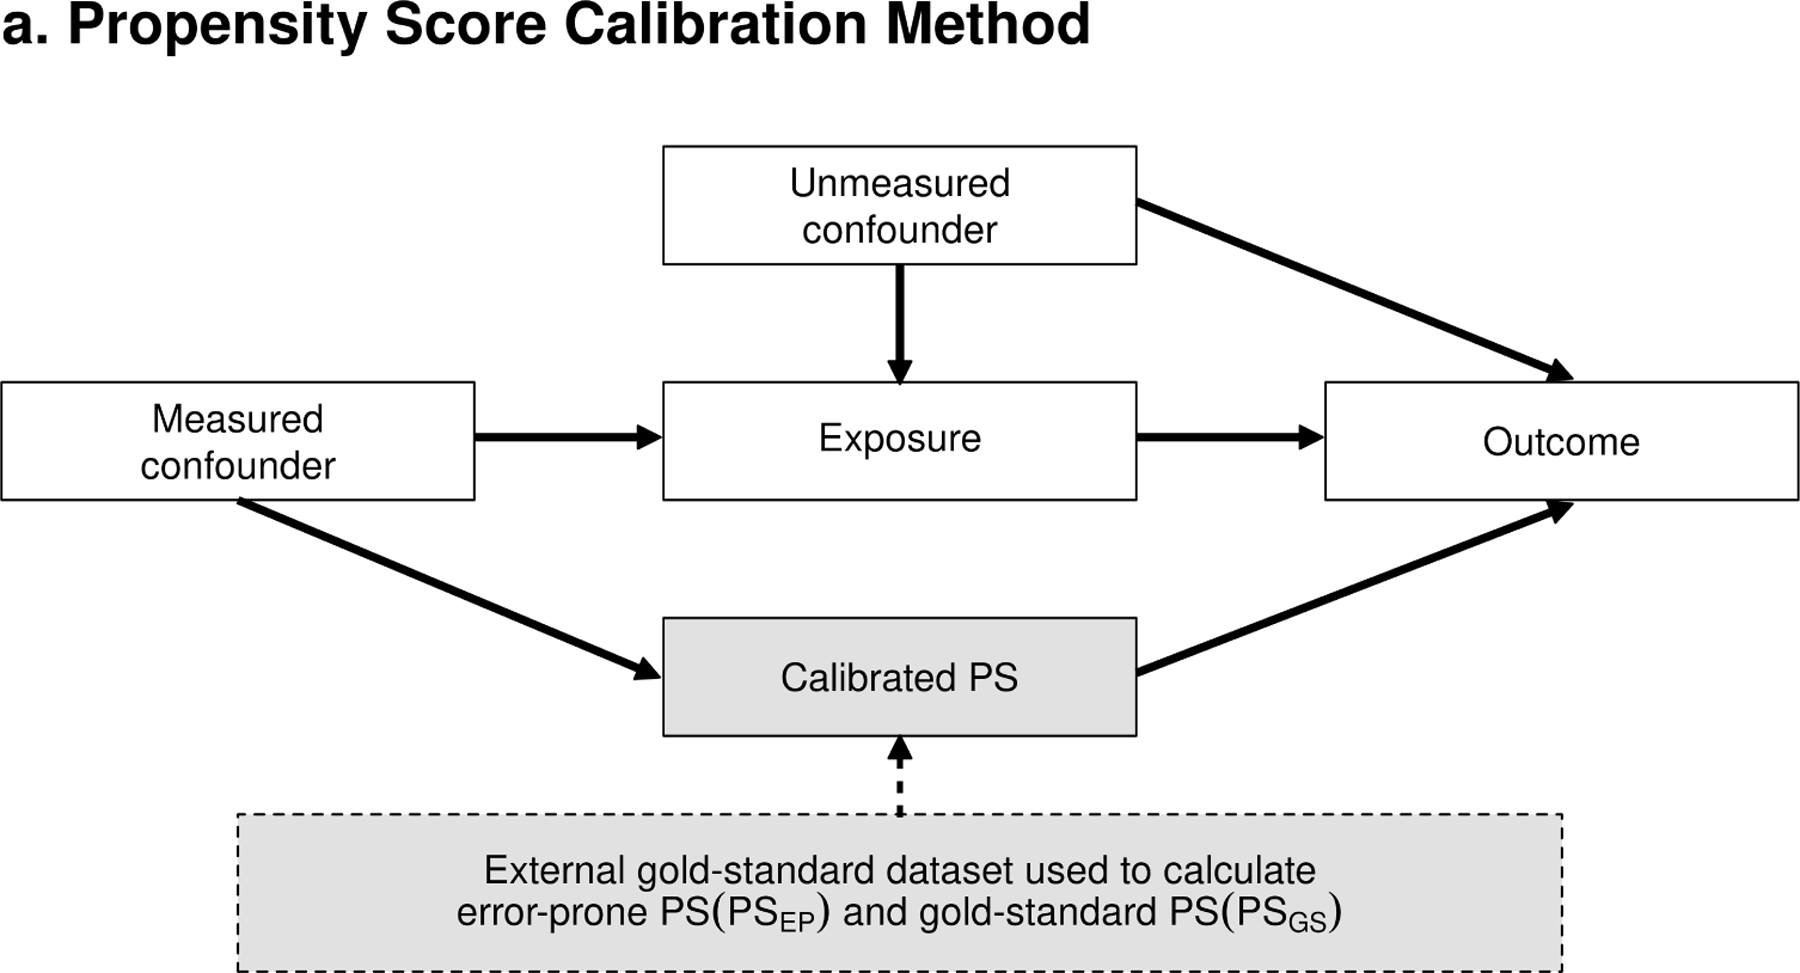
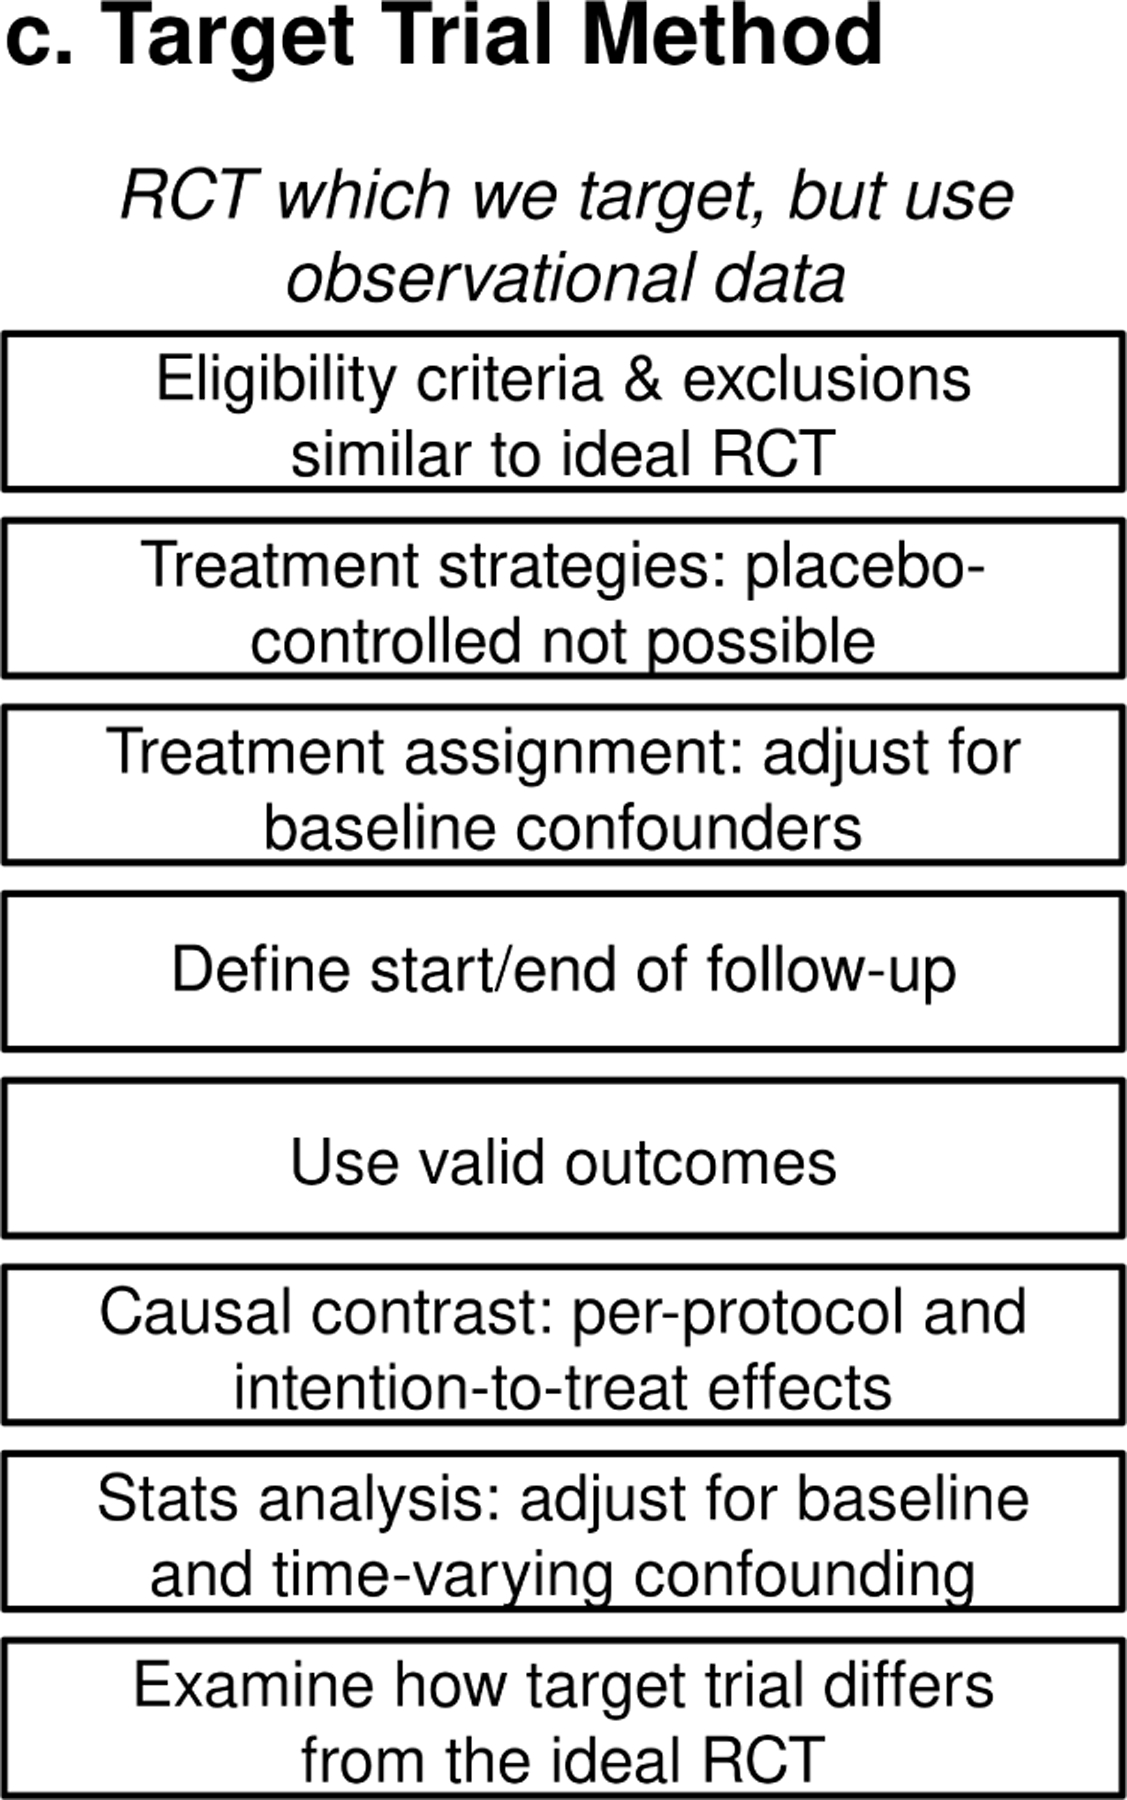
Four different statistical approaches to minimize unmeasured confounding are the propensity score calibration, instrumental variable method, target trials, and the negative control method [13,14].
Propensity score calibration (PSC) adjusts for residual confounding in the error-prone main dataset by importing information about the unmeasured confounders from a smaller, external “gold-standard” dataset [15]. Analysis in the main dataset is then adjusted using a single-dimension propensity score of the measured confounders corrected for unmeasured confounding by regression calibration against the gold-standard propensity score (See Figure 2a). For example, suppose we are using a registry dataset (main dataset) to study the association between fixation type and revision. We know that body mass index (BMI) is a confounder of this relationship, but unfortunately it is not available in the registry dataset. We then use a different external “gold-standard” validation dataset that includes the same variables as in the registry dataset as well as BMI. A propensity score is calculated for the registry dataset without BMI. Propensity score is also calculated for the validation dataset first without BMI then with BMI to estimate the error in the propensity score. We then apply regression calibration to adjust the main propensity score for the estimated error from the gold-standard validation dataset analysis.
Fig. 2.

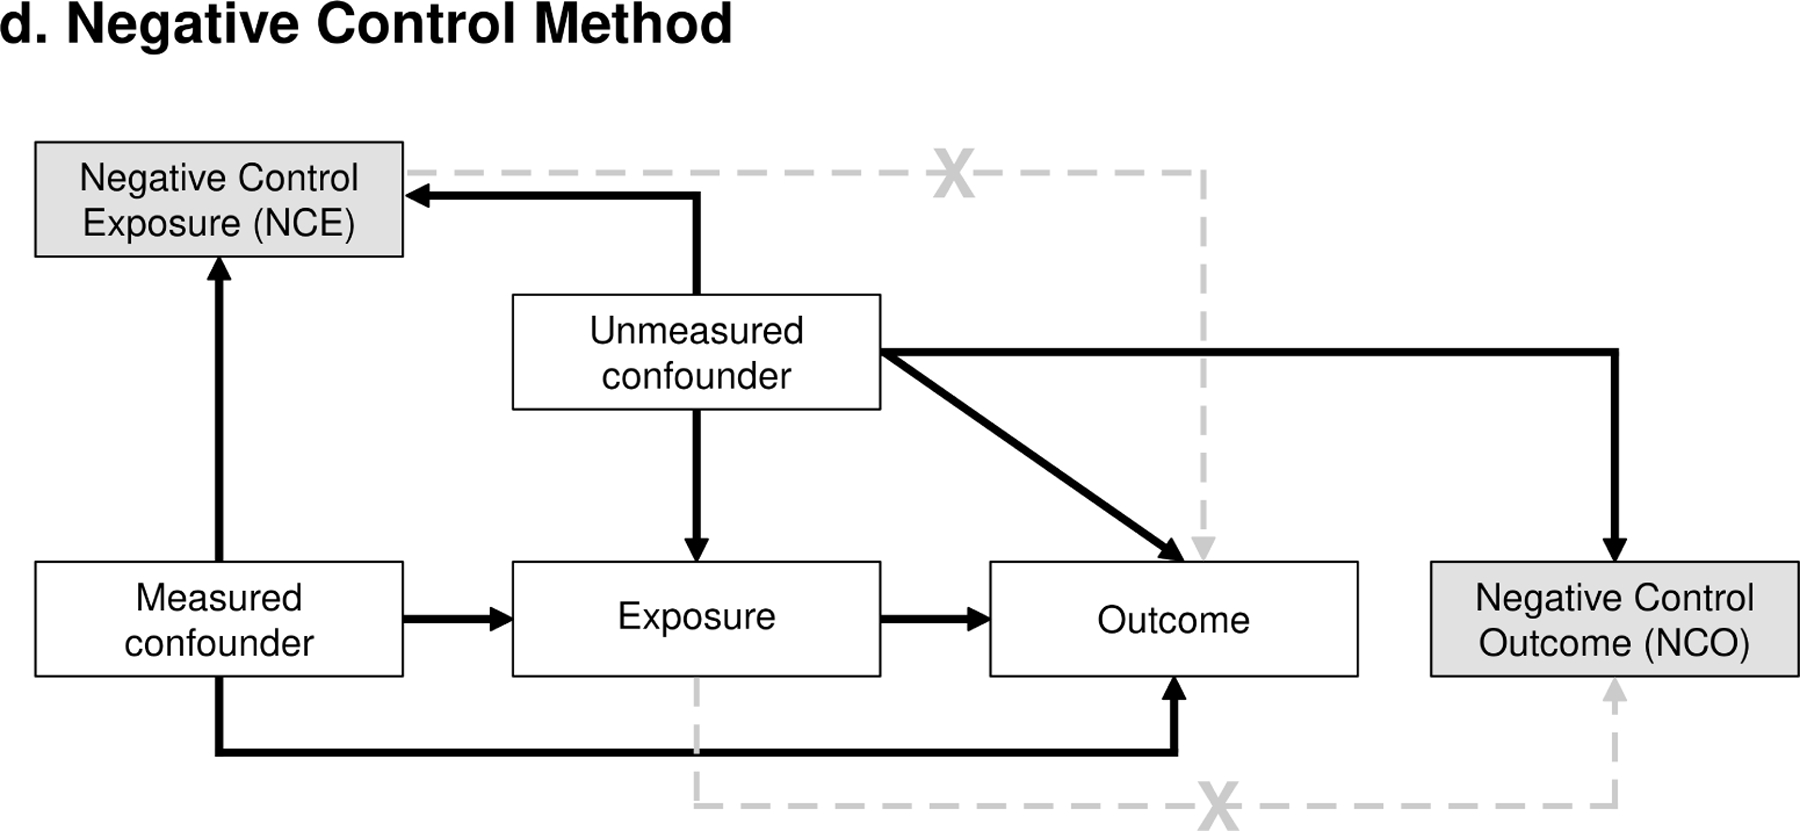
Four different statistical approaches to mitigate unmeasured confounders. a. Propensity score calibration method; b. Instrumental variable method; c. Target trial method; d. Negative control method.
Instrumental variable methods rely on an external variable (i.e., instrument) that determines the exposure of interest, but is not associated with the outcome other than through its effect on the exposure [16] (See Figure 2b). Furthermore, the association between the instrumental variable and the exposure should not be confounded by other variables. Although it is often difficult to identify a perfect instrument and challenges with interpretation, this method has been previously used to compare the risk of revision between hemiarthroplasty vs total hip arthroplasty (THA) for femoral neck fractures and patellar resurfacing using institutional or surgeon preferences as the instrumental variables [17,18]. Over the past two decades, advances in genetic technologies have enabled the identification of reproducible associations between genetic variants and environmental exposures, traits, and health outcomes. Due to random assortment of genetic variants at conception, genetic variants are independent of potential confounders. These genetic variants are used as proxies for the modifiable exposures of interest through a study method called Mendelian randomization [19]. For example, a single-nucleotide polymorphism (SNP) in the nicotinic acetylcholine receptor alpha 3 subunit CHRNA3 gene was used as a proxy for smoking quantity to evaluate the causal role of smoking on the risk of osteoarthritis and subsequent arthroplasty, providing strong evidence that smoking may be causally associated with the reduced risk [20].
With the target trial method, the research hypothesis and the statistical analysis are framed in the context of an ideal randomized controlled trial [21]. To emulate randomization, baseline covariates are balanced at time 0, and weighting that accounts for the treatment received is used to maintain balance and reduce the effect of confounding (See Figure 2c). The target trial approach was recently used to estimate the causal relationship between surgeon and/or hospital volumes and postoperative outcomes [22]. Target trials typically require a larger sample size, and more complex analysis, but allow to explore more than one casual effect.
In the negative control method, the focus is on identifying a variable known not to be casually affected by the exposure, defined as the negative control outcome (NCO). Similarly, a negative control exposure (NCE) is defined as a variable not casually related to the outcome of interest (See Figure 2d). The presence of association between NCO and the primary exposure of interest, or NCE and primary outcome of interest is evidence of residual confounding, allowing the evaluation of different adjustments. For example, in a study examining the risk of dislocation (outcome), the presence of association between this variable and cup fixation (NCE) would indicate residual confounding that needs to be accounted for in the analysis. This is because, typically, there is no causal relationship between cup fixation and dislocation.
Finally, sensitivity analysis can be used to address the potential effect of unmeasured confounders. A frequently used method is the E-value, which is the minimum strength of the association that an unmeasured confounder must have with exposure and outcome, conditional on the measured covariates, to explain the observed relationship between the two [23,24]. The E-value is calculated from the observed risk ratio and its interpretation depends on the context.
In conclusion, correlations are common in observational studies and should not be automatically interpreted as causation. Orthopaedic investigators should carefully differentiate between the two when designing their studies or interpreting findings in the literature. If there are concerns with respect to chance, reverse causality, measured or unmeasured confounding, appropriate statistical methods should be applied.
Guidelines for researchers and reviewers
Here are a few practical guidelines that can help orthopaedic researchers to navigate the complex topic of correlation vs causation when conducting a study or evaluating other studies.
Evaluate the relationship between the variables of interest
If association is found, determine whether this association is coincidental, reversed, or confounded
Establish whether there is evidence or plausible reason regarding the direction of the effect (X → Y)
Determine temporality (Does X precede Y?)
If establishing causation is the study goal, but a randomized trial is not available, consider using different design and analysis approaches to minimize the effect of measured and unmeasured confounders such as propensity score calibration, or target trial, and methods to exclude reverse causality such as Mendelian randomization.
Funding:
This work was funded by a grant from the National Institute of Arthritis and Musculoskeletal and Skin Diseases (NIAMS) grant P30AR76312 and the American Joint Replacement Research-Collaborative (AJRR-C). The content is solely the responsibility of the authors and does not necessarily represent the official views of the National Institutes of Health. The funders of the study had no role in study design, data collection, data analysis, data interpretation, or writing of the report. The corresponding author had full access to all the data in the study, and all authors had final responsibility for the decision to submit for publication.
Footnotes
Publisher's Disclaimer: This is a PDF file of an unedited manuscript that has been accepted for publication. As a service to our customers we are providing this early version of the manuscript. The manuscript will undergo copyediting, typesetting, and review of the resulting proof before it is published in its final form. Please note that during the production process errors may be discovered which could affect the content, and all legal disclaimers that apply to the journal pertain.
Conflict of Interest: One or more of the authors of this paper have disclosed potential or pertinent conflicts of interest, which may include receipt of payment, either direct or indirect, institutional support, or association with an entity in the biomedical field which may be perceived to have potential conflict of interest with this work.
References
- [1].Varady NH, Feroe AG, Fontana MA, Chen AF. Causal language in observational orthopaedic research. J Bone Joint Surg Am 2021;103:e76. 10.2106/JBJS.20.01921. [DOI] [PubMed] [Google Scholar]
- [2].Sattar N, Preiss D. Reverse causality in cardiovascular epidemiological research: more common than imagined? Circulation 2017;135:2369–72. 10.1161/CIRCULATIONAHA.117.028307. [DOI] [PubMed] [Google Scholar]
- [3].Allen KD, Thoma LM, Golightly YM. Epidemiology of osteoarthritis. Osteoarthritis Cartilage 2022;30:184–95. 10.1016/j.joca.2021.04.020. [DOI] [PMC free article] [PubMed] [Google Scholar]
- [4].Thornqvist C, Gislason GH, Kober L, Jensen PF, Torp-Pedersen C, Andersson C. Body mass index and risk of perioperative cardiovascular adverse events and mortality in 34,744 Danish patients undergoing hip or knee replacement. Acta Orthop 2014;85:456–62. 10.3109/17453674.2014.934184. [DOI] [PMC free article] [PubMed] [Google Scholar]
- [5].Rotevatn TA, Boggild H, Olesen CR, Torp-Pedersen C, Mortensen RN, Jensen PF, et al. Alcohol consumption and the risk of postoperative mortality and morbidity after primary hip or knee arthroplasty - A register-based cohort study. PLoS One 2017;12:e0173083. 10.1371/journal.pone.0173083. [DOI] [PMC free article] [PubMed] [Google Scholar]
- [6].Devick KL, Zaniletti I, Larson DR, Lewallen DG, Berry DJ, Maradit Kremers H. Avoiding Systematic Bias in Orthopedics Research Through Informed Variable Selection: A Discussion of Confounders, Mediators, and Colliders. J Arthroplasty 2022;37:1951–5. 10.1016/j.arth.2022.05.027. [DOI] [PMC free article] [PubMed] [Google Scholar]
- [7].Wyles CC, Maradit-Kremers H, Larson DR, Lewallen DG, Taunton JJ, Trousdale RT, et al. Creation of a total hip arthroplasty patient-specific dislocation risk calculator. J Bone Joint Surg 2022;104:1068–80. 10.2106/JBJS.21.01171. [DOI] [PMC free article] [PubMed] [Google Scholar]
- [8].Skou ST, Roos EM, Laursen MB, Rathleff MS, Arendt-Nielsen L, Simonsen O, et al. A randomized, controlled trial of total knee replacement. N Engl J Med 2015;373:1597–606. 10.1056/NEJMoa1505467. [DOI] [PubMed] [Google Scholar]
- [9].Shimonovich M, Pearce A, Thomson H, Keyes K, Katikireddi SV. Assessing causality in epidemiology: revisiting Bradford Hill to incorporate developments in causal thinking. Eur J Epidemiol 2021;36:873–87. 10.1007/s10654-020-00703-7. [DOI] [PMC free article] [PubMed] [Google Scholar]
- [10].Lawlor DA, Tilling K, Davey Smith G. Triangulation in aetiological epidemiology. Int J Epidemiol 2016;45:1866–86. 10.1093/ije/dyw314. [DOI] [PMC free article] [PubMed] [Google Scholar]
- [11].Munafo MR, Davey Smith G. Robust research needs many lines of evidence. Nature 2018;553:399–401. 10.1038/d41586-018-01023-3. [DOI] [PubMed] [Google Scholar]
- [12].Larson DR, Zaniletti I, Lewallen DG, Berry DJ, Maradit-Kremers H. Propensity scores: confounder adjustment when comparing non-randomized groups in orthopedic surgery. J Arthroplasty; in press [DOI] [PMC free article] [PubMed]
- [13].Streeter AJ, Lin NX, Crathorne L, Haasova M, Hyde C, Melzer D, et al. Adjusting for unmeasured confounding in nonrandomized longitudinal studies: a methodological review. J Clin Epidemiol 2017;87:23–34. 10.1016/j.jclinepi.2017.04.022. [DOI] [PMC free article] [PubMed] [Google Scholar]
- [14].Uddin MJ, Groenwold RH, Ali MS, de Boer A, Roes KC, Chowdhury MA, et al. Methods to control for unmeasured confounding in pharmacoepidemiology: an overview. Int J Clin Pharm 2016;38:714–23. 10.1007/s11096-016-0299-0. [DOI] [PubMed] [Google Scholar]
- [15].Stürmer T, Schneeweiss S, Avorn J, Glynn RJ. Adjusting effect estimates for unmeasured confounding with validation data using propensity score calibration. Am J Epidemiol 2005;162:279–89. 10.1093/aje/kwi192. [DOI] [PMC free article] [PubMed] [Google Scholar]
- [16].Maciejewski ML, Brookhart MA. Using instrumental variables to address bias from unobserved confounders. JAMA 2019;321:2124–5. 10.1001/jama.2019.5646. [DOI] [PubMed] [Google Scholar]
- [17].Farey JE, Cuthbert AR, Adie S, Harris IA. Bipolar hemiarthroplasty does not result in a higher risk of revision compared with total hip arthroplasty for displaced femoral neck fractures: an instrumental variable analysis of 36,118 procedures from the Australian Orthopaedic Association National Joint Replacement Registry. J Bone Joint Surg Am 2022;104:919–27. 10.2106/JBJS.21.00972. [DOI] [PubMed] [Google Scholar]
- [18].Vertullo CJ, Graves SE, Cuthbert AR, Lewis PL. The effect of surgeon preference for selective patellar resurfacing on revision risk in total knee replacement: an instrumental variable analysis of 136,116 procedures from the Australian Orthopaedic Association National Joint Replacement Registry. J Bone Joint Surg Am 2019;101:1261–70. 10.2106/JBJS.18.01350. [DOI] [PubMed] [Google Scholar]
- [19].Hartley AE, Power GM, Sanderson E, Smith GD. A guide for understanding and designing Mendelian randomization studies in the musculoskeletal field. JBMR Plus 2022;6:e10675. 10.1002/jbm4.10675. [DOI] [PMC free article] [PubMed] [Google Scholar]
- [20].Johnsen MB, Vie GA, Winsvold BS, Bjorngaard JH, Asvold BO, Gabrielsen ME, et al. The causal role of smoking on the risk of hip or knee replacement due to primary osteoarthritis: a Mendelian randomisation analysis of the HUNT study. Osteoarthritis Cartilage 2017;25:817–23. 10.1016/j.joca.2016.12.021. [DOI] [PubMed] [Google Scholar]
- [21].Hernan MA, Robins JM. Using big data to emulate a target trial when a randomized trial is not available. Am J Epidemiol 2016;183:758–64. 10.1093/aje/kwv254. [DOI] [PMC free article] [PubMed] [Google Scholar]
- [22].Madenci AL, Wanis KN, Cooper Z, Subramanian SV, Haneuse S, Hofman A, et al. Comparison of mortality risk with different surgeon and hospital operative volumes among individuals undergoing pancreatectomy by emulating target trials in US Medicare beneficiaries. JAMA Netw Open 2022;5:e221766. 10.1001/jamanetworkopen.2022.1766. [DOI] [PMC free article] [PubMed] [Google Scholar]
- [23].Haneuse S, VanderWeele TJ, Arterburn D. Using the E-Value to assess the potential effect of unmeasured confounding in observational studies. JAMA 2019;321:602–3. 10.1001/jama.2018.21554. [DOI] [PubMed] [Google Scholar]
- [24].VanderWeele TJ, Ding P, Mathur M. Technical considerations in the use of the E-value. J Causal Inference 2019;7:20180007. 10.1515/jci-2018-0007. [DOI] [Google Scholar]