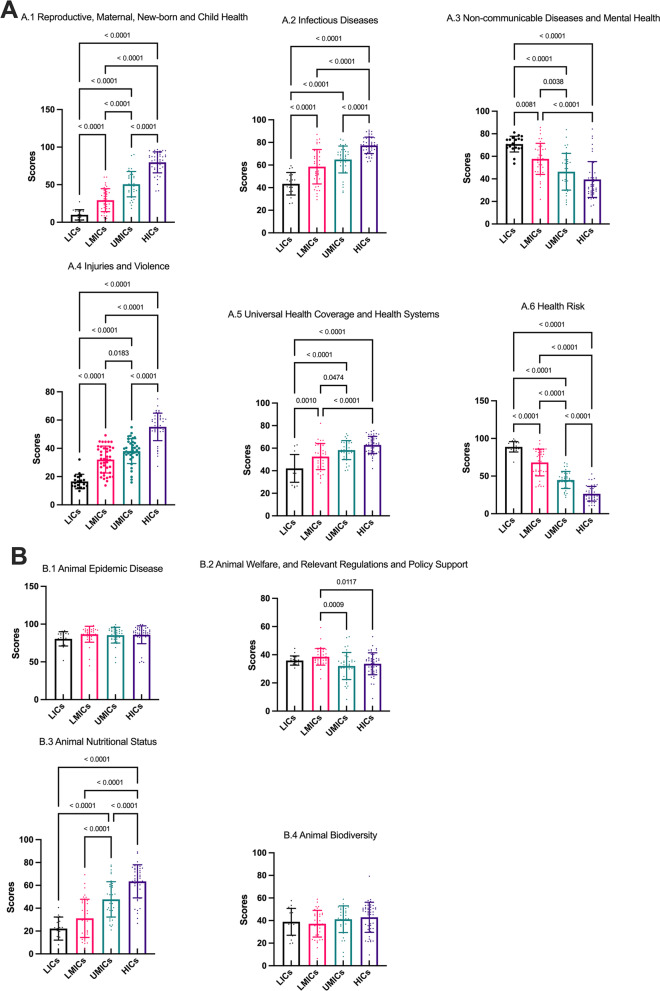
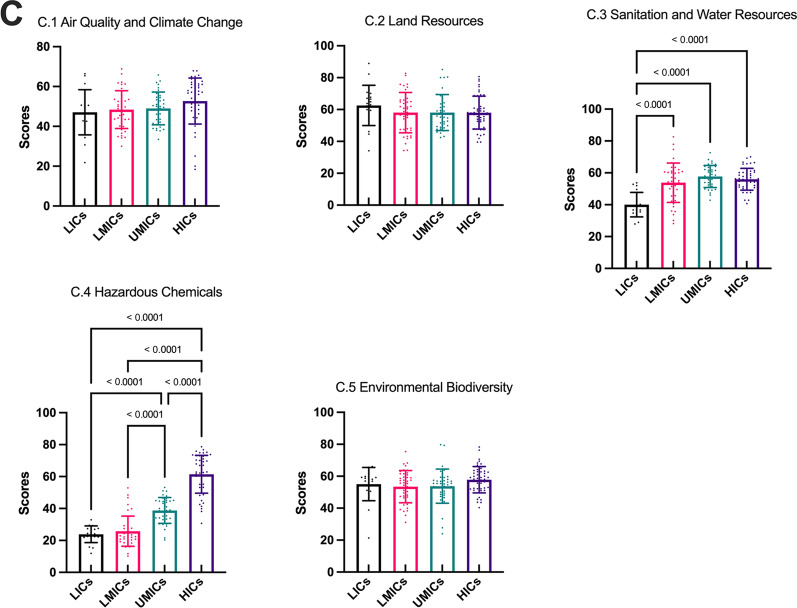
Fig. 7.
Mean (SD) of GOH-IDI and critical indicator scores in different World Bank income groups. The different bar chart colors represent different regions. The error line represents the standard deviation. The dots represent the distribution of the data and correspond to the vertical. Detailed data are listed in Additional file 2. Descriptive analyze are listed in Additional file 3. SD standard deviation, GOH-IDI Global One Health Intrinsic Driver Index, LICs low-income countries, LMICs lower middle-income countries, UMICs upper middle-income countries, HICs high income-countries


