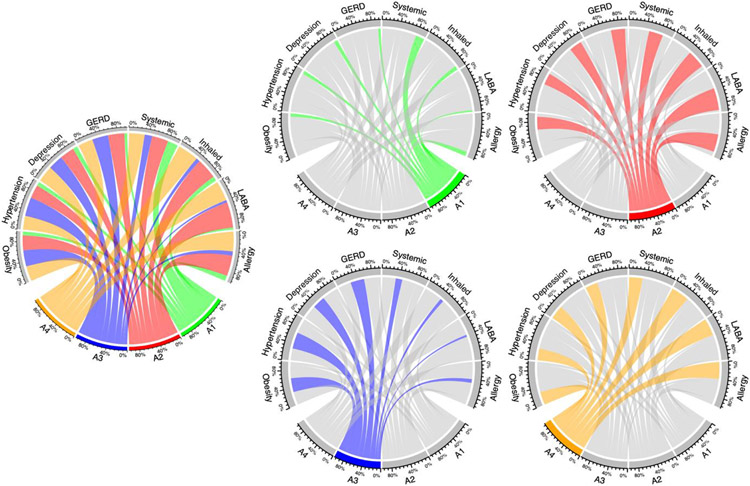
Figure 4: Graphical Depiction of Adult Subtypes.
Left center: All subtypes; then from top left to bottom right: A1, A2, A3, A4.
For each individual figure, the color shading is anchored to the subtype represented. The projections of that color go to the characteristics found in the subtype, and the width of those projections represents the relative proportion of patients in that subtype who have that characteristic.

