Figure 8.
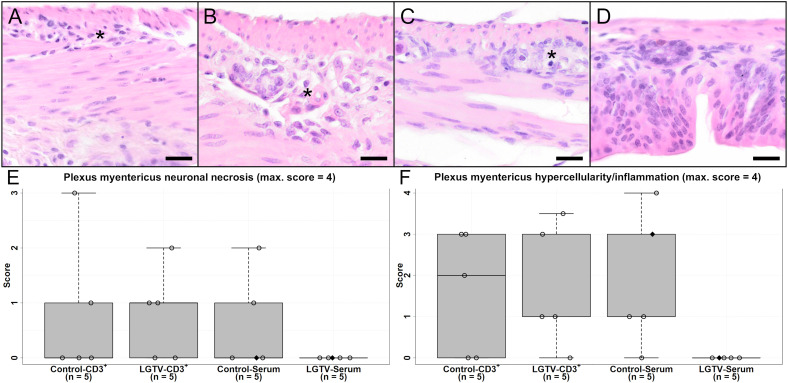
H&E stained sections of caecum of one representative mouse from each group (A) CD3+ T cell transfer from control donors; (B) CD3+ T cell transfer from LGTV infected donors; (C) serum transfer from control donors; (D) serum transfer from LGTV infected donors). The plexus myentericus displays varying degrees of ganglioneuritis in (A–C) (asterisk). No histopathological changes in the plexus myentericus of the mouse from the serum transfer of LGTV infected donor group (D) are detectable. Scale bars: 20 µm. (E, F) display box plots of the scoring values for plexus myentericus neuronal necrosis (E) and plexus myentericus hypercellularity/inflammation (F) of caecum for each group. Mice that differed in their clinical state from other mice in the control and LGTV serum recipient group are highlighted as rhombus shaped symbols in the box plots.

