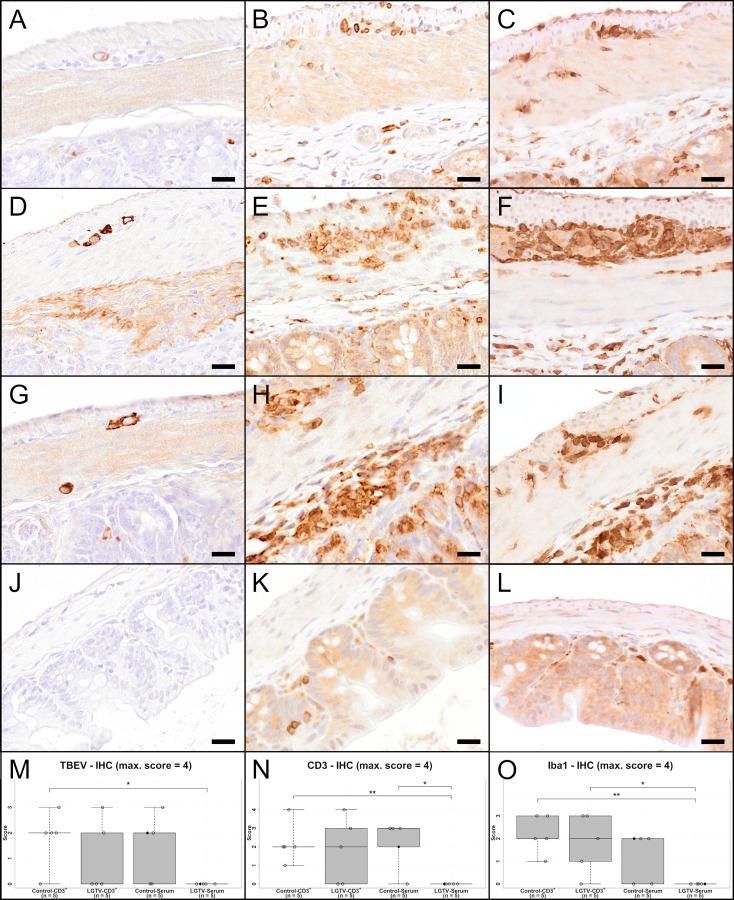
Figure 9.
IHC of caecum for TBEV (A, D, G, J), T cell marker CD3 (B, E, H, K) and microglia/macrophage marker Iba1 (C, F, I, L) of one representative mouse from each group (A–C) CD3+ T cell transfer from control donors; (D–F) CD3+ T cell transfer from LGTV infected donors; (G–I) serum transfer from control donors; (J–L) serum transfer from LGTV infected donors). TBEV E protein is detectable in the cytoplasm of neurons in the plexus myentericus and submucosus in all mice (A, D, G) except the ones in the group of the serum transfer from LGTV infected donor mice (J). Ganglioneuritis in affected mice is characterized by CD3-positive T cell infiltration in both plexus (B, E, H). No CD3-immunoreaction in the plexus of the serum transfer from LGTV infected donor mice is detectable (K). In addition, an infiltration of plexus with Iba1-positive macrophages in affected mice (C, F, I) in comparison to mice of the group serum transfer from LGTV infected donor mice is detectable (L). Scale bars: 20 µm. (M–O) display box plots of the scoring values of IHC for TBEV (IHC-TBEV; (M), IHC for CD3 (IHC-CD3; (N) and IHC for macrophage marker Iba1 (Iba1-IHC; (O). Significant differences detected by pairwise Wilcoxon rank-sum tests after non-parametric ANOVA and multiple testing adjustment are indicated by asterisks (* p < 0.05; ** p< 0.01). Mice that differed in their clinical state from other mice in the control and LGTV serum recipient group are highlighted as rhombus shaped symbols in the box plots.

