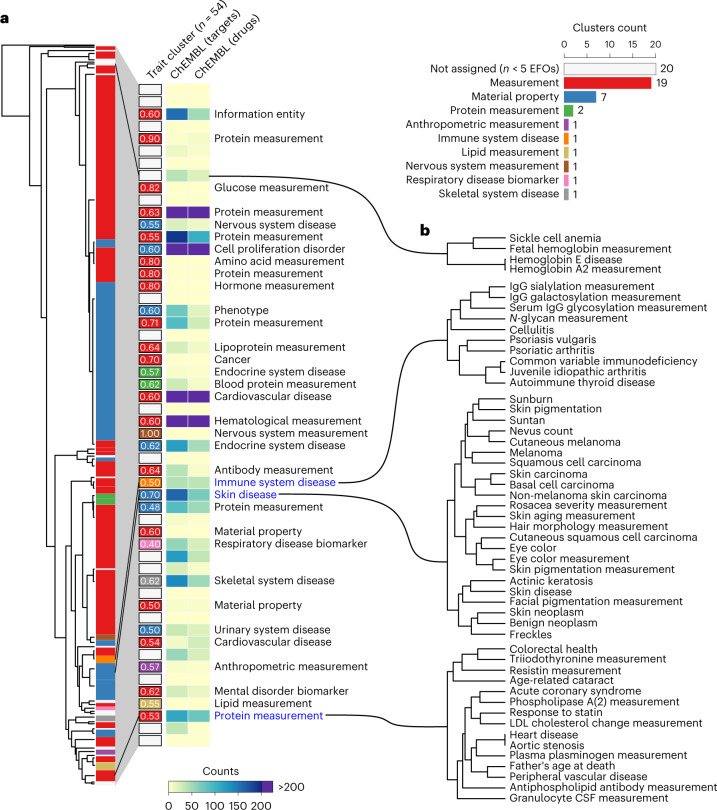
Fig. 2. Trait–trait genetic and functional similarities determined from network expansion of GWAS data.
a, Tree showing the Manhattan distance between all traits, using the full PPR score. Hierarchical clustering was performed using a cutoff of h = 1, leading to 54 clusters, colored depending on the predominant EFO ancestry term. The right-hand panel is a barplot showing the 54 clusters with the frequencies for the predominant EFO ancestry terms and a heatmap showing the counts for ChEMBL targets and drugs. The text label next to each cluster corresponds to the second most predominant EFO terms that, on average, label 35% of the traits within the clusters that have a text label. b, Examples of traits grouped using the Manhattan distance, extracted from the tree in a. CSF, colony-stimulating factor; Ig, immunolglobulin; LDL, low-density lipoprotein.

