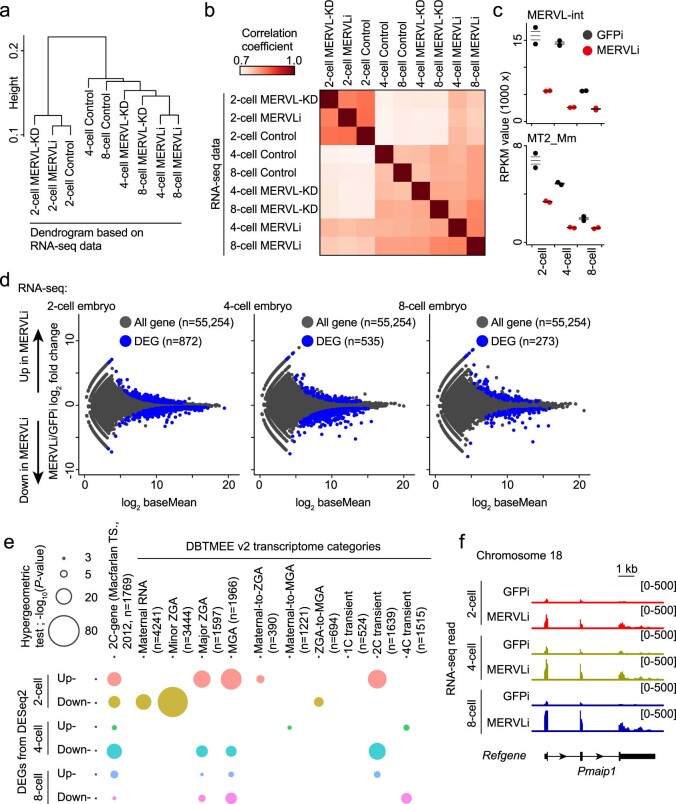
Extended Data Fig. 6. RNA-seq analysis upon CRISPRi induction shows that MERVLi embryos resemble ASO-mediated MERVL-KD embryos.
(a) Unsupervised hierarchical cluster of all annotated transcript profiles (n = 55,254) from RNA-seq data in embryos from different groups and developmental stages. Each dendrogram leaf represents an RNA-seq sample and the y-axis shows the distance based on Pearson correlation between each pair of samples. (b) Heatmap showing pairwise Pearson correlation coefficient of gene expression between each pair of samples. (c) Dot plots showing RPKM values for MERVL-int and MT2_Mm in GFPi control and MERVLi embryos. Central bars represent medians, the top and bottom lines encompass 50% of the data points. (d) RNA-seq differential gene expression analysis: MERVLi versus GFPi control embryos obtained at two-cell, four-cell and eight-cell stages. 872, 535 and 273 genes evinced significant changes in expression in MERVLi embryos (blue circles, Padj < 0.05; binomial test with Benjamini–Hochberg correction). (e) Bubble plot showing overlap between all DEGs in MERVLi embryos with the list of 2C genes and DBTMEE v2 transcriptome categories. The bubble plot sizes show the -log10[P values] derived from a hypergeometric test. (f) Track views show RNA-seq signals in GFPi control and MERVLi embryos, on a representative 2C gene locus (as defined in 12). The y-axis represents normalized tag counts for total RNA-seq in each sample. Data for panels in a-e are available as source data.

