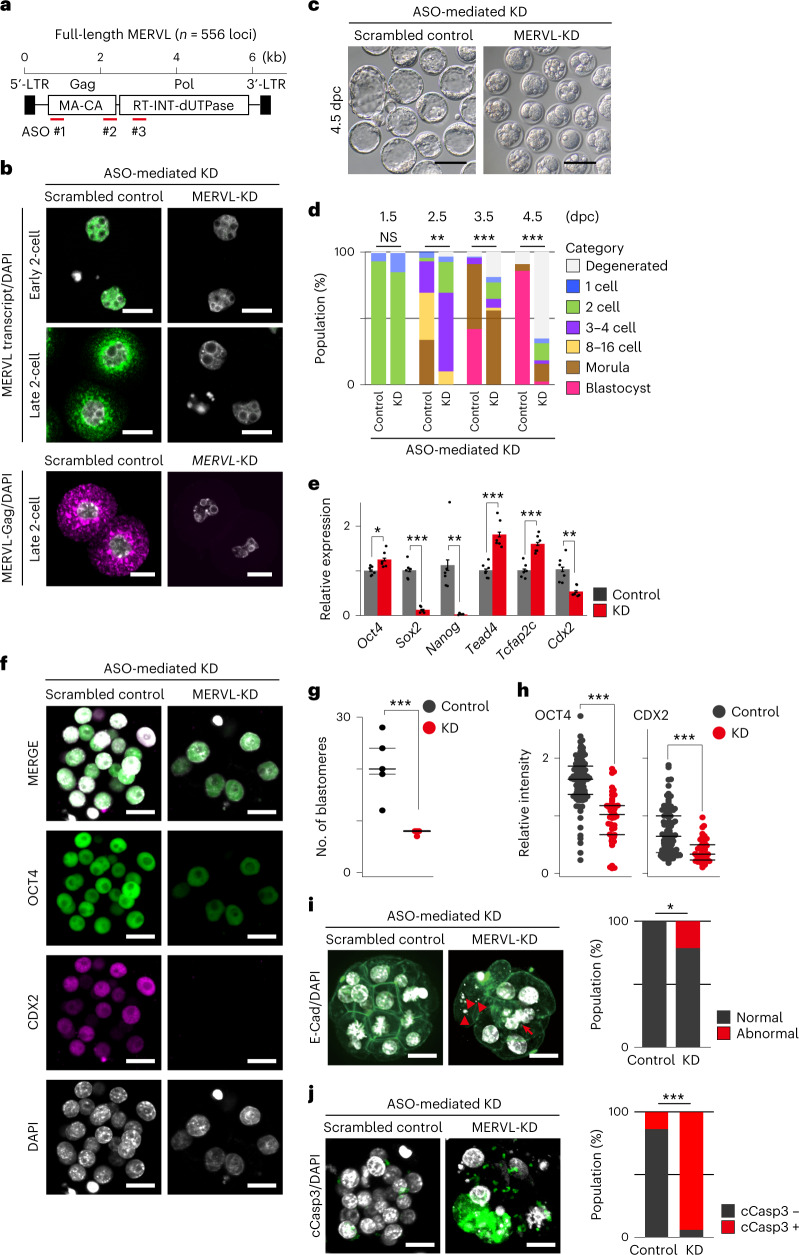
Fig. 2. MERVL plays a critical role in early lineage specification and maintaining genomic stability of preimplantation embryos.
a, Schematic of full-length MERVL, indicating the positions of ASOs. b, Representative images of smFISH for MERVL RNA (green) with DAPI counterstain (gray) in control and MERVL-KD embryos at early and late two-cell stages, from six independent experiments (top). Representative images of immunofluorescence staining for MERVL-Gag protein (pink) with DAPI counterstain (gray) in control and MERVL-KD embryos at late two-cell stage, from three independent experiments (bottom). Scale bars, 20 µm. c, Representative phase-contrast images of 4.5 dpc blastocysts in control and MERVL-KD, from four independent experiments. Scale bars, 100 µm. d, Percentage of embryos by stages of development in control (n = 84) and MERVL-KD (n = 104). NS, not significant; **P < 0.01; ***P < 0.001, chi-square test. e, Expressions of ICM- and TE-associated genes, as measured by qRT-PCR in control and MERVL-KD morula at 3.5 dpc. Bars show means with standard error of the mean (s.e.m.). Dots represent biological replicates (n = 6). *P < 0.05, **P < 0.01, ***P < 0.001, two-tailed unpaired t-tests. f, Representative images of immunofluorescence staining for OCT4 and CDX2 with DAPI counterstain in control and MERVL-KD morula at 3.5 dpc, from three independent experiments. Scale bars, 20 µm. g,h, Dot plots showing the total number of blastomere per embryo and relative intensity for OCT4 and CDX2 per nucleus in control and MERVL-KD morula at 3.5 dpc, normalized to DAPI signal. Central bars represent medians, and the top and bottom lines encompass 50% of the data points. ***P < 0.001, two-tailed unpaired t-tests. i, Representative images of immunofluorescence staining for E-cadherin (E-Cad, green) with DAPI counterstain (gray) in control and MERVL-KD morula at 3.5 dpc, from two independent experiments (left). Arrows and arrowheads indicate nuclear deformation and micronuclei. Scale bars, 20 µm. Bar chart showing the percentage of abnormal nuclear morphology at morula stage (right). *P < 0.05, chi-square test. j, Representative images of immunofluorescence staining for cleaved caspase-3 (cCasp3, green) with DAPI counterstain (gray) in control and MERVL-KD morula at 3.5 dpc, from three independent experiments (left). Scale bars, 20 µm. Bar chart showing the percentage of apoptotic cells per embryo at morula stage (right). ***P < 0.001, chi-square test. Data for panels in d, e and g–j are available as source data.

