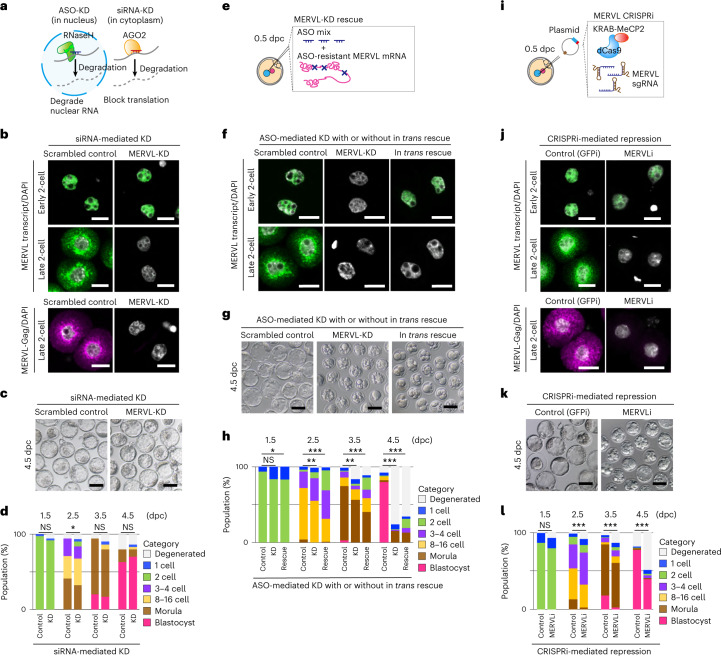
Fig. 3. Retroviral proteins and trans-acting MERVL RNA are dispensable for preimplantation development.
a, Schematic of the distinct mechanisms underlying ASO- versus siRNA-mediated RNA targeting. b Representative images of smFISH for MERVL RNA (green) with DAPI counterstain (gray) in control and MERVL-KD embryos at early and late two-cell stages, from four independent experiments (top). Representative images of immunofluorescence staining for MERVL-Gag protein (pink) with DAPI (gray) counterstain in control and MERVL-KD embryos at late two-cell stage, from three independent experiments (bottom). Scale bars, 20 µm. c, Representative phase-contrast images of 4.5 dpc blastocysts in control and MERVL-KD by siRNA, from three independent experiments. Scale bars, 100 µm. d, Percentage of embryos by stages of development in control (n = 73) and MERVL-KD (n = 59). *P < 0.05, chi-square test. e, Schematic of experimental procedure for in trans rescuing MERVL-KD by ASOs. f, Representative images of smFISH for MERVL RNA with DAPI counterstain in early and late two-cell stage embryos in each experimental condition, from four independent experiments. Scale bars, 20 µm. g, Representative phase-contrast images of 4.5 dpc blastocysts in each experimental condition, from two independent experiments. Scale bars, 100 µm. h, Percentage of embryos by stages of development in each experimental condition (n = 78 for control, n = 80 for MERVL-KD and n = 132 for in trans rescue). *P < 0.05; **P < 0.01; ***P < 0.001, chi-square test. i, Schematic of experimental procedure for CRISPRi targeting the MERVL sequence. j, Representative images of smFISH for MERVL RNA (green) with DAPI counterstain (gray) in GFPi control (CRISPRi targeting GFP) and MERVLi (CRISPRi targeting MERVL) embryos at early and late two-cell stages, from three independent experiments (top). Representative images of immunofluorescence staining for MERVL-Gag protein (pink) with DAPI counterstain (gray) in GFPi control and MERVLi embryos at late two-cell stage, from three independent experiments (bottom). Scale bars, 20 µm. k, Representative phase-contrast images of 4.5 dpc blastocysts upon GFPi control and MERVLi condition, from 3 independent experiments. Scale bars, 100 µm. l Percentage of embryos by stages of development upon GFPi control (n = 149) and MERVLi (n = 137). ***P < 0.001, chi-square test. Data for panels in d, h and l are available as source data.

