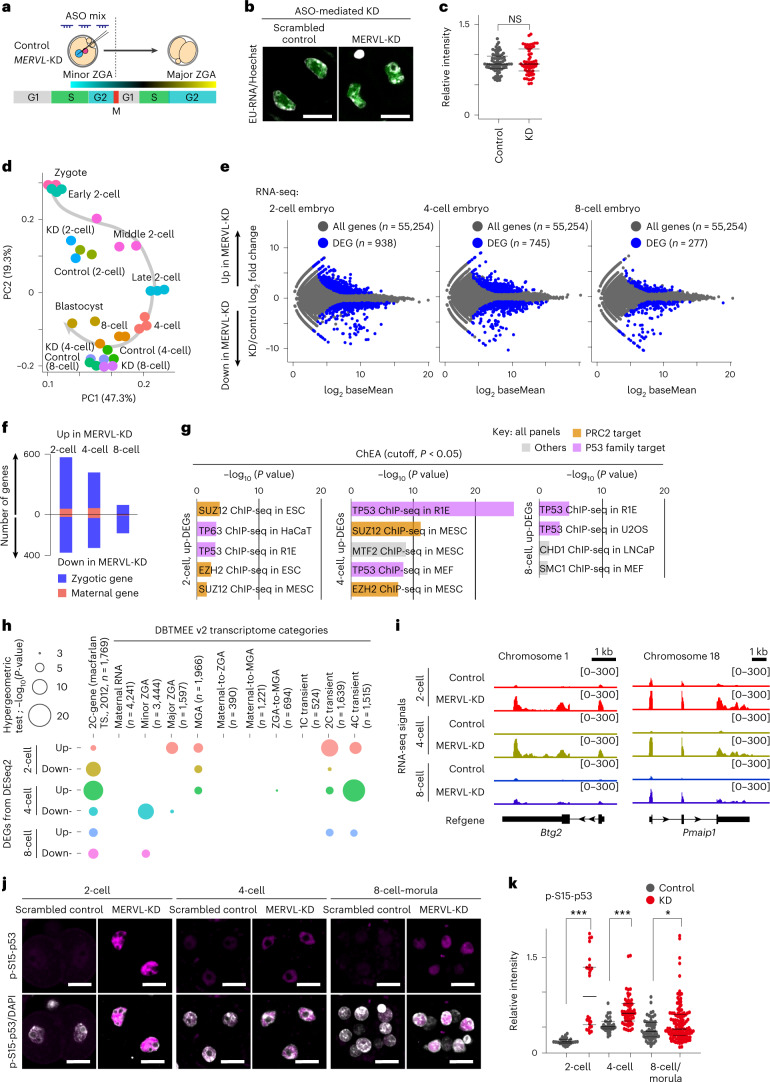
Fig. 4. Ablation of MERVL impacts the expression of a subset of two-cell genes through preimplantation development.
a, Schematic of timing for minor and major ZGA (adapted from Abe et al.6). b, Representative images of EU incorporation assay (green) with Hoechst 33342 counterstain (gray) in control and MERVL-KD two-cell stage embryos, from three independent experiments. Scale bars, 20 µm. c, The relative intensity of EU per nucleus, normalized to Hoechst 33342 signal. NS, not significant by two-tailed unpaired t-tests. d, Bidimensional principal-component (PC) analysis of gene expression profiles in control and MERVL-KD embryos through preimplantation development. e, RNA-seq differential gene expression analysis: MERVL-KD versus control embryos obtained at two-cell, four-cell and eight-cell stages; 938, 745 and 277 genes evinced significant changes in expression in MERVL-KD embryos (blue circle, fold change ≥ |2|, P value adjusted (Padj) < 0.05, binomial test with Benjamini–Hochberg correction). f, Stacked bar chart shows the number of upregulated (up)- and downregulated (down)-DEGs. The populations of maternally inherited RNA (as defined in DBTMEE v2; refs. 32,33) and others (zygotically expressed genes) are highlighted in red and blue. g, Predicted factors that are upstream of all up-DEGs upon MERVL-KD, assessed by the ChEA database34. ChIP-seq, chromatin immunoprecipitation with sequencing; HaCaT, cultured human keratinocyte; MEF, mouse embryonic fibroblast; MESC, mouse embryonic stem cell; LNCaP, lymph node carcinoma of the prostate. h, Bubble plot showing overlap between all DEGs in MERVL-KD embryos with the list of two-cell (2C) genes and DBTMEE v2 transcriptome categories. The bubble plot sizes show the –log10[P values] derived from a hypergeometric test. i, Track views show RNA-seq signals in control and MERVL-KD embryos, on two representative 2C gene loci (as defined in Macfarlan et al.12). The y-axis represents normalized tag counts for total RNA-seq in each sample. Refgene, refseq gene in NCBI and UCSC. j, Representative images of immunofluorescence staining for phosphorylated p53 on serine 15 (p-S15-p53, pink) with DAPI counterstain (gray) in control and ASO-mediated MERVL-KD embryos, from three independent experiments. Scale bars, 20 µm. k, Dot plots showing the relative intensity for p-S15-p53 per nucleus in control and MERVL-KD embryos, normalized to DAPI signal. Central bars represent medians, the top and bottom lines encompass 50% of the data points. *P < 0.05 and ***P < 0.001, two-tailed unpaired t-tests. Data for panels in c–h and k are available as source data.

