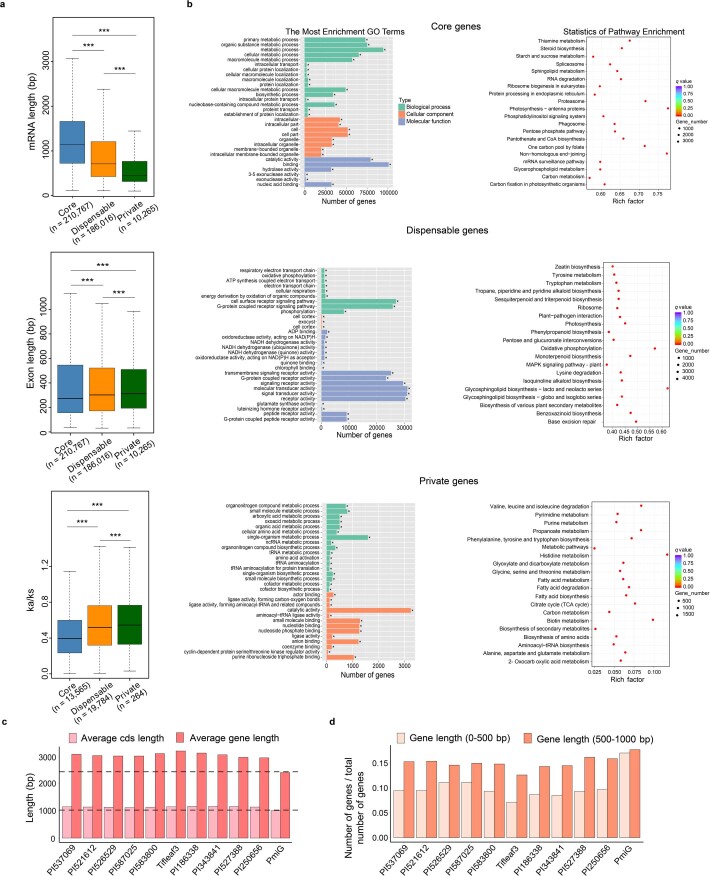
Extended Data Fig. 4. Characterization of core, dispensable, and unique gene sets.
a, mRNA length, exon length, and ka/ks values of the three gene categories. Center line, median; box limits, upper and lower quartiles; whiskers, 1.5x interquartile range; and dots represent outliers. Significant differences were tested by two-tailed t-test (***P < 0.0005). b, Gene Ontology (GO) (left) and Kyoto Encyclopedia of Genes and Genomes (KEGG) (right) enrichment results. Significant differences were tested by hypergeometric test (*FDR-adjusted P < 0.05). c, Comparison of average CDS and gene length across all accessions. The dotted lines indicate average CDS and gene lengths in the PmiG genome. d, Comparison of proportion of genes in two length ranges across all accessions.

