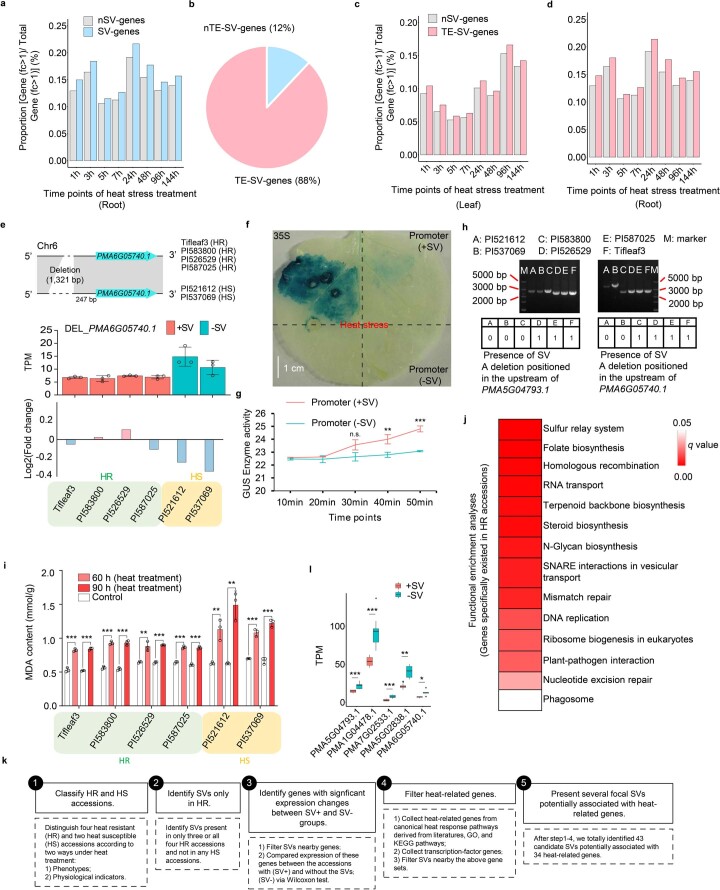
Extended Data Fig. 9. Potential contributions of structural variations (SVs) to heat tolerance in pearl millet.
a, Proportion of genes with expression fold changes over 1 compared to total gene expression. nSV-genes and SV-genes: genes not located near SVs (over 5 kb) and genes located near SVs (within 5 kb), respectively. b, Composition of genes close to SVs overlapping with transposons (TE-SV-genes) or not overlapping with transposons (nTE-SV-genes). c-d, These two panels are similar to panel a but compares TE-SV-genes to nSV-genes. e, One example shows the presence of a fixed SV in the HR group near PMA6G05740.1. The lower panel shows the gene expression changes in PMA6G05740.1 under 24 h heat treatment in the HR and HS groups. Error bars, mean ± s.d.; n = 3 biological replicates. TPM: transcripts per million. ‘+SV’ and ‘-SV’: accessions with and without SVs, respectively. f-g, Transformation of the PMA6G05740.1 promoter in tobacco leaves. f: GUS phenotype observed by histochemical staining. Scale bar indicates 1 cm. g: Quantitative detection of GUS enzyme levels with a fluorescence microplate in leaves. Error bars, mean ± s.d.; n = 3 biological replicates. Significant differences were tested by two-tailed t-test (*P < 0.05, ***P < 0.0005; n.s., not significant). h, PCR validation of two SVs positioned in upstream regions of PMA5G04793.1 and PMA6G05740.1. Each experiment is performed once. The images were cropped from the images in the Source data file. i, Malondialdehyde (MDA) levels of four heat-resistant (HR) and two heat-susceptible (HS) accessions. Error bars, mean ± s.d.; n = 3 biological replicates. Significant differences were tested by two-tailed t-test (**P < 0.01, ***P < 0.0005). j, Functional enrichment analyses of genes specifically found in the HR group. k, Pipeline of identifying focal candidate SVs potentially related to expression changes of nearby heat-related genes. l, Comparisons of the expression (TPM) of five genes between accessions with (+SV) and without SVs (-SV). These five genes are from panel e in this figure and from Fig. 5c and g. PMA5G04793.1, PMA1G04478.1, and PMA7G02533.1: n = 9 biological replicates for ‘+SV’ and ‘-SV’, respectively; PMA5G02838.1 and PMA6G05740.1: n = 12 biological replicates for ‘+SV’ and n = 6 for ‘-SV’. Center line, median; box limits, upper and lower quartiles; whiskers, 1.5x interquartile range; and dots represent outliers. Significant differences were tested by two-tailed t-test (*P < 0.05, **P < 0.01, ***P < 0.0005). Source data are provided as a Source Data file.

