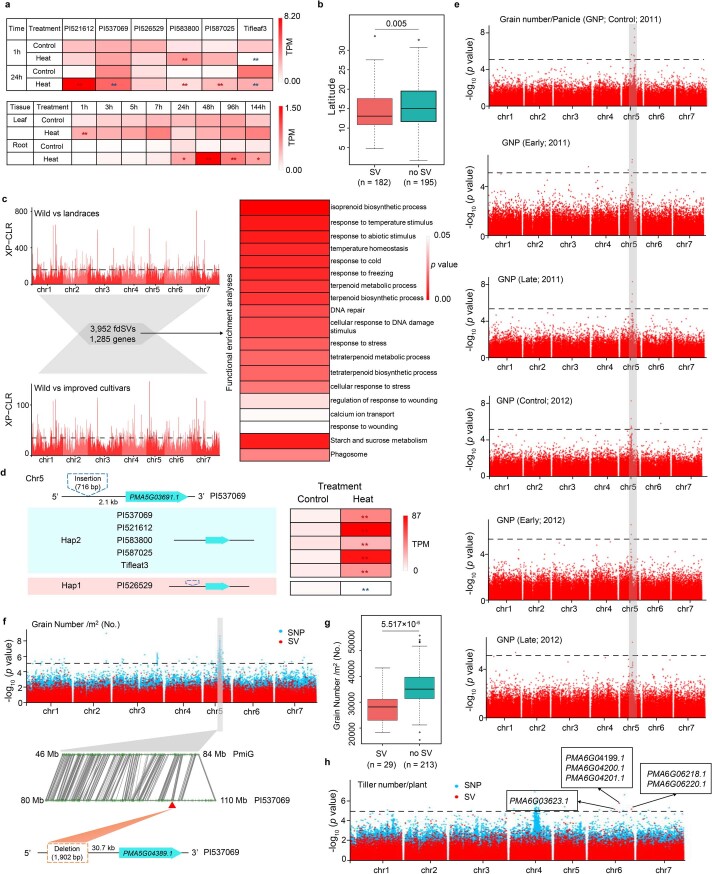
Extended Data Fig. 10. Contributions of structural variations (SVs) to heat tolerance adaptation and domestication.
a, Expression patterns of PMA2G02653.1. Significant differences were performed by DESeq2 to determine fold change (FC) of gene expressions between control and heat-treatment groups (two-tailed Wald test). The FC was determined by * (0 < |log2FC|< 1, FDR-adjusted P < 0.05) or ** (|log2FC|>= 1, FDR-adjusted P < 0.05). The blue and red */** represent gene down- and upregulation, respectively. b, Comparison of the latitudinal distributions of the two SV-related haplotypes of pearl millet accessions. Center line, median; box limits, upper and lower quartiles; whiskers, 1.5x interquartile range; and dots represent outliers. Significant differences were tested by two-tailed t-test and shown by p value. c, SV-based selection sweep analyses. A total of 3,952 SVs with population frequency differences (fdSVs) were identified in both comparisons and harbored 1,285 genes. The black dotted line represents a cut-off window in which the top 1% of data points were selected as the sweep region. The right panel represents the functional enrichment analyses of the 1,285 genes. d, Expression levels of one candidate gene (PMA5G03691.1)-related haplotype. Significant differences were performed by DESeq2 to determine fold change (FC) of gene expressions between control and heat-treatment groups (two-tailed Wald test). The FC was determined by * (0 < |log2FC|< 1, FDR-adjusted P < 0.05) or ** (|log2FC|>= 1, FDR-adjusted P < 0.05). The blue and red ** represent gene down- and upregulation, respectively. e, PAV-GWAS of SVs associated with grain number/panicle (GNP). Control: condition without stress. Early: early drought stress inhibiting irrigation from one week before flowering until maturity. Late: late drought stress conducted during early grain-filling by inhibiting irrigation from 50% flowering time until maturity. The regions marked by grey box indicate the GNP-related QTL could be captured by different conditions. f, PAV-GWAS of SVs associated with the grain number/m2 (GNM2) trait. g, Comparison of GNM2 between accessions with SVs and without SVs. Center line, median; box limits, upper and lower quartiles; whiskers, 1.5x interquartile range; and dots represent outliers. Significant differences were tested by two-tailed t-test and shown by p value. h, PAV-GWAS of SVs associated with the tiller number/plant (Till) trait. PmiG: Tift 23D2B1-P1-P5. The dotted-line represents the significance threshold of -log10 (p value) > 5.

