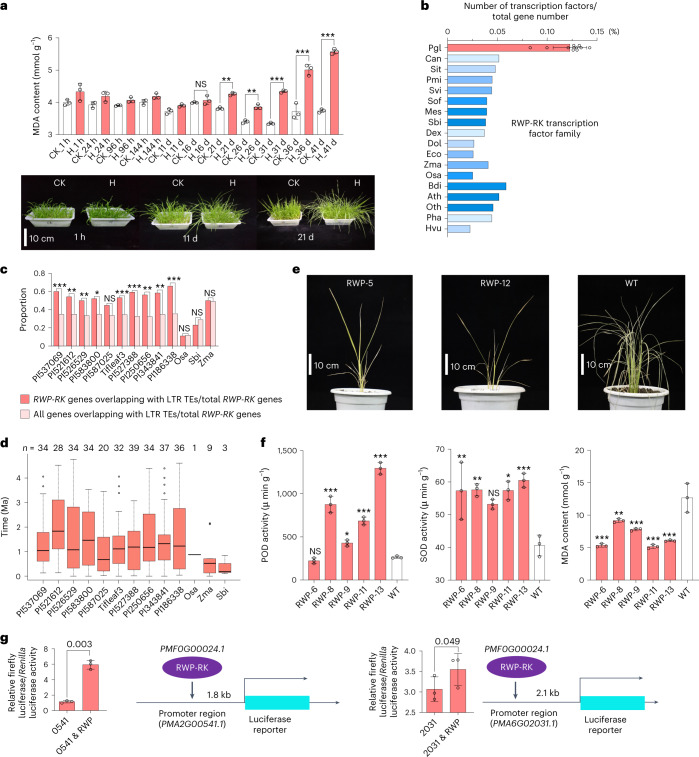
Fig. 3. Expansion of the RWP-RK transcription factor family contributes to heat tolerance.
a, Comparison of MDA levels between the control (CK) and heat treatment (H) groups of pearl millet (Tifleaf3). The error bars indicate the mean ± s.d.; n = 3 biological replicates. Significant differences were tested by two-tailed t-test (**P < 0.01, ***P < 0.0005; NS, not significant). b, Proportion of RWP-RK transcription factor family members among all the genes in the 11 pearl millet genomes and ten other genomes. Ath, Arabidopsis thaliana; Bdi, Brachypodium distachyon; Can, Capsicum annuum; Dex, Digitaria exilis; Dol, Dichanthelium oligosanthes; Eco, Eleusine coracana; Hvu, Hordeum vulgare; Mes, Manihot esculenta; Osa, O. sativa; Oth, Oropetium thomaeum; Pgl, P. glaucum (pearl millet); Pha, Panicum hallii; Pmi, Panicum miliaceum; Sbi, Sorghum bicolor; Sit, Setaria italica; Sof, Saccharum officinarum; Svi, Setaria viridis; Zma, Z. mays. c, Comparisons of RWP-RK gene numbers overlapping with intact LTR TEs among pearl millet, rice, sorghum and maize. Significant differences were tested by one-tailed binomial test (*P < 0.05, **P < 0.01, ***P < 0.0005). d, Estimated insertion times of LTR TEs encompassing the RWP-RK genes shown in c. The center line represents the median; the box limits represent the upper and lower quartiles; the whiskers represent 1.5 times the IQR; the dots represent the outliers. e, Phenotypes of two transgenic lines and a control (WT) after 72 h of heat treatment. f, POD and SOD activity after 12 h of heat treatment and MDA content after 72 h of heat treatment in transgenic lines and WT plants. The error bars represent the mean ± s.d.; n = 3 biological replicates. Significant differences were tested using a two-tailed t-test (*P < 0.05, **P < 0.01, ***P < 0.0005). g, Dual luciferase assays (firefly luciferase to Renilla luciferase ratio) were applied to verify that PMF0G00024.1 (RWP) could transactivate PMA2G00541.1 (541) and PMA6G02031.1 (2031). The error bars represent the mean ± s.d.; n = 3 biological replicates. Significant differences were tested using a two-tailed t-test and are shown as P values.

