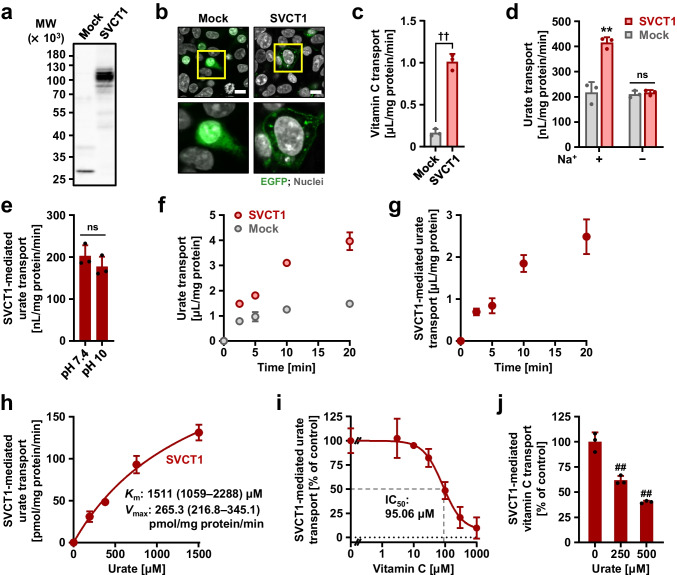
Fig. 1.
Identification and characterization of human SVCT1 as a urate transporter. All uptake assays were conducted using transiently SVCT1-expressing HEK293 cells 48 h after plasmid transfection in Krebs–Ringer buffer. Experimental conditions: pH 7.4 unless otherwise indicated, or pH 10 (h); [1-14C]-vitamin C in the transport buffer was 20 μM (c, j); incubation time and [8-14C]-urate in the transport buffer were 5 min and 10 μM, respectively, unless otherwise indicated. a–c Functional expression of SVCT1 in HEK293 cells 48 h after the transfection. (a) Immunoblot detection of SVCT1 protein in whole-cell lysates. (b) Intracellular localization of SVCT1 detected by confocal microscopy. Magnified images of representative cells denoted by yellow squares are demonstrated. Scale bars: 10 μm. (c) [1-14C]-Vitamin C transport activities into the cells. d–i SVCT1 as a urate transporter. (d) Sodium-dependency in SVCT1-mediated urate transport. (e) Insignificant effect of an alkaline pH condition (pH 10) on the urate transport activity of SVCT1. (f) Time-dependent [8-14C]-urate incorporation into SVCT1-expressing or mock (control) cells. (g) Time profile for SVCT1-mediated [8-14C]-urate uptake into HEK293 cells, which was calculated by subtracting the urate transport activity of mock cells from that of SVCT1-expressing cells. (h) Concentration dependence in SVCT1-mediated [8-14C]-urate transport. Regarding the estimated Michaelis-Menten constant (Km) and maximal velocity (Vmax), the 95% confidence interval values were provided in parentheses. (I) Concentration-dependent inhibition of SVCT1-mediated urate transport by vitamin C. IC50, the half-maximal inhibitory concentration. j Inhibitory effect of urate on SVCT1-mediated vitamin C transport at physiological concentrations. Values are shown as % of vehicle control (i, j). Data are expressed as the mean ± SD; where vertical bars are not displayed, the SD was contained within the limits of the symbol; n = 3. ††P < 0.01 (two-sided t-test; c, e); ns, not significantly different between groups; **P < 0.01 vs. the other groups (Tukey–Kramer multiple-comparison test; d); ##P < 0.01 vs. vehicle control (Williams’ multiple-comparison test; j)

