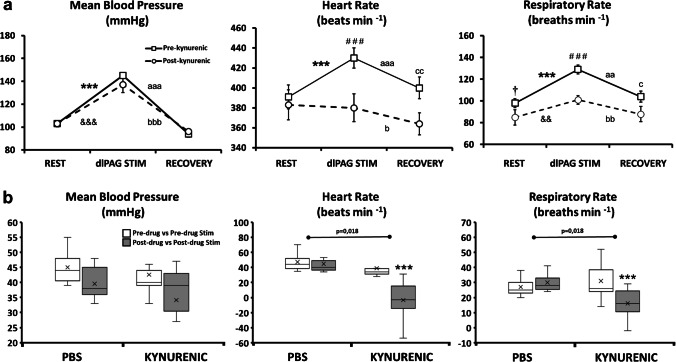
Fig. 3.
a Changes of mean blood pressure, heart rate and respiratory rate before (rest), during (dlPAG stimulation) and 5 min after (recovery) dlPAG stimulation (before (pre-kynurenic, empty square) and after microinjection of kynurenic (post-kynurenic, empty circle) within the A5 region). Data expressed as mean ± SEM. ***p<0.001, pre-drug vs pre-drug stimulation; &&p<0.01, &&&p<0.001, post-drug vs post-drug stimulation; †p<0.05, pre-drug vs post-drug; ###p<0.001, pre-drug stimulation vs post-drug stimulation; aap<0.01, aaap<0.001, pre-drug stimulation vs recovery; bp<0.05, bbp<0.01, bbbp<0.001, post-drug stimulation vs recovery; cp<0.05, ccp<0.01, pre-drug recovery vs post-drug recovery. b Box-Whisker graphs showing the differences between the delta cardiorespiratory responses after PBS or kynurenic microinjections within the A5 region during dlPAG stimulation (mean blood pressure, heart rate and respiratory rate responses) (before (pre-drug vs pre-drug stim; empty box) and after (post-drug vs post-drug stim; filled box) microinjections of PBS or kynurenic within the A5 region). ***p<0.001

