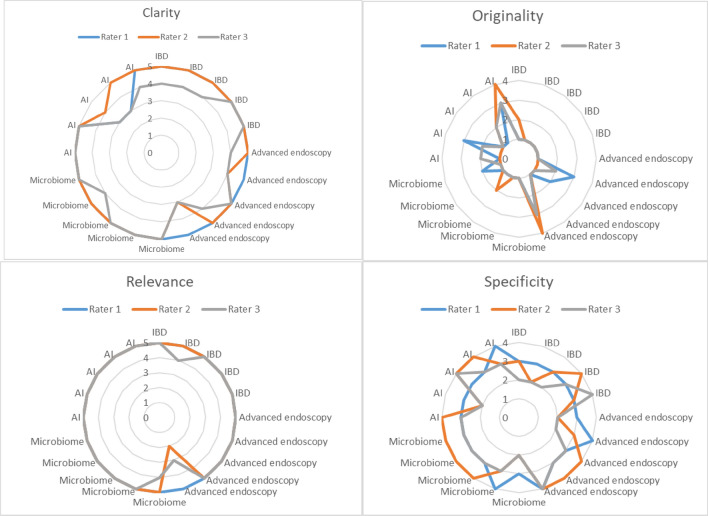
Figure 1.
Level of inter-rater agreement and the mean grades in all categories for every topic. The figure illustrates the level of inter-rater agreement and the mean grades in all categories for every topic. When the curves representing the ratings of different evaluators are closer together within the circle, it indicates a higher level of agreement among them. The further the curve is from the outer edge of the diagram, the higher the grades given by the evaluators. The monotonic nature of the curves suggests that the raters are consistent between their assessments.

